Open Access
Fig. 8.
Download original image
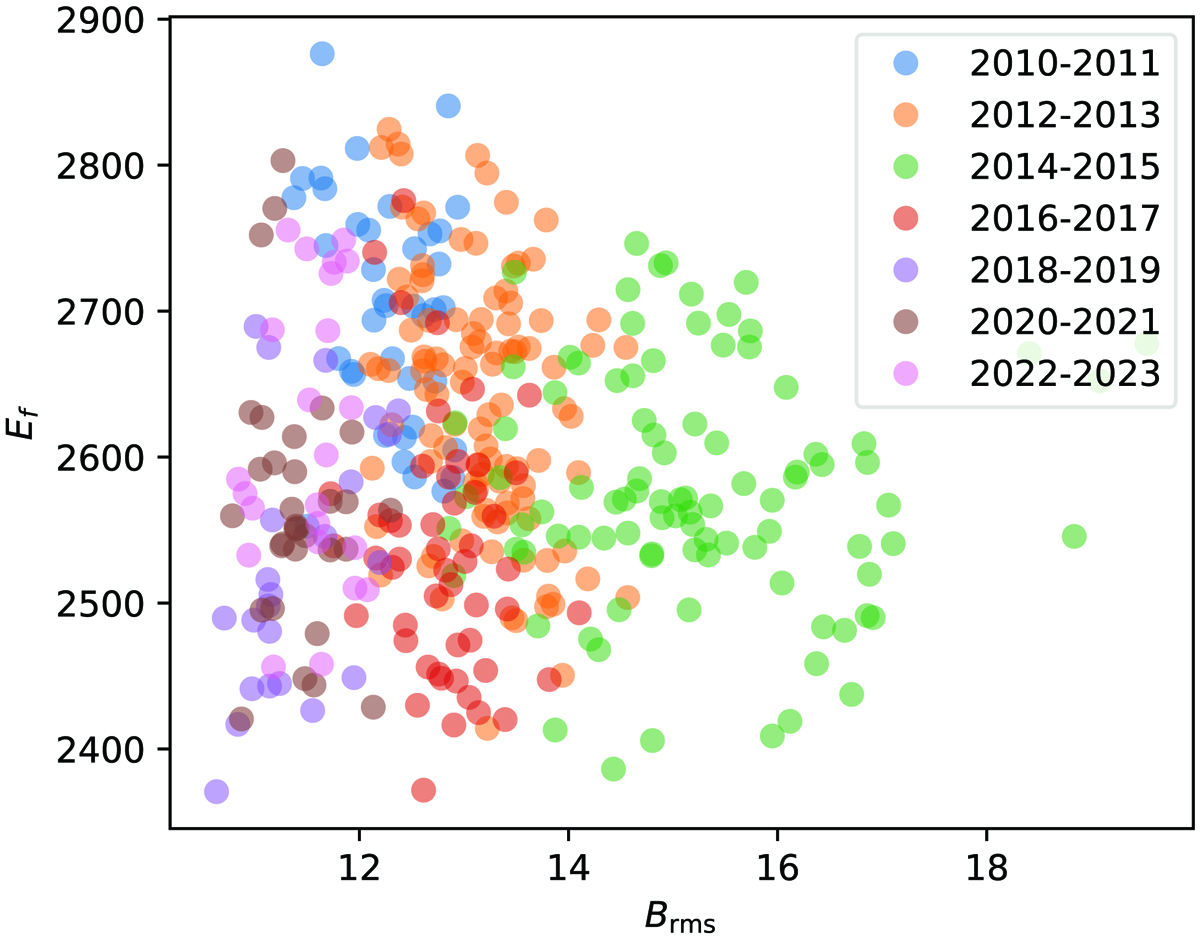
f-mode energy as a function of Brms for the most quiet patches at disk center. The colors indicate the grouping according to the years. The standard deviation for the f-mode variation is 87.
Current usage metrics show cumulative count of Article Views (full-text article views including HTML views, PDF and ePub downloads, according to the available data) and Abstracts Views on Vision4Press platform.
Data correspond to usage on the plateform after 2015. The current usage metrics is available 48-96 hours after online publication and is updated daily on week days.
Initial download of the metrics may take a while.