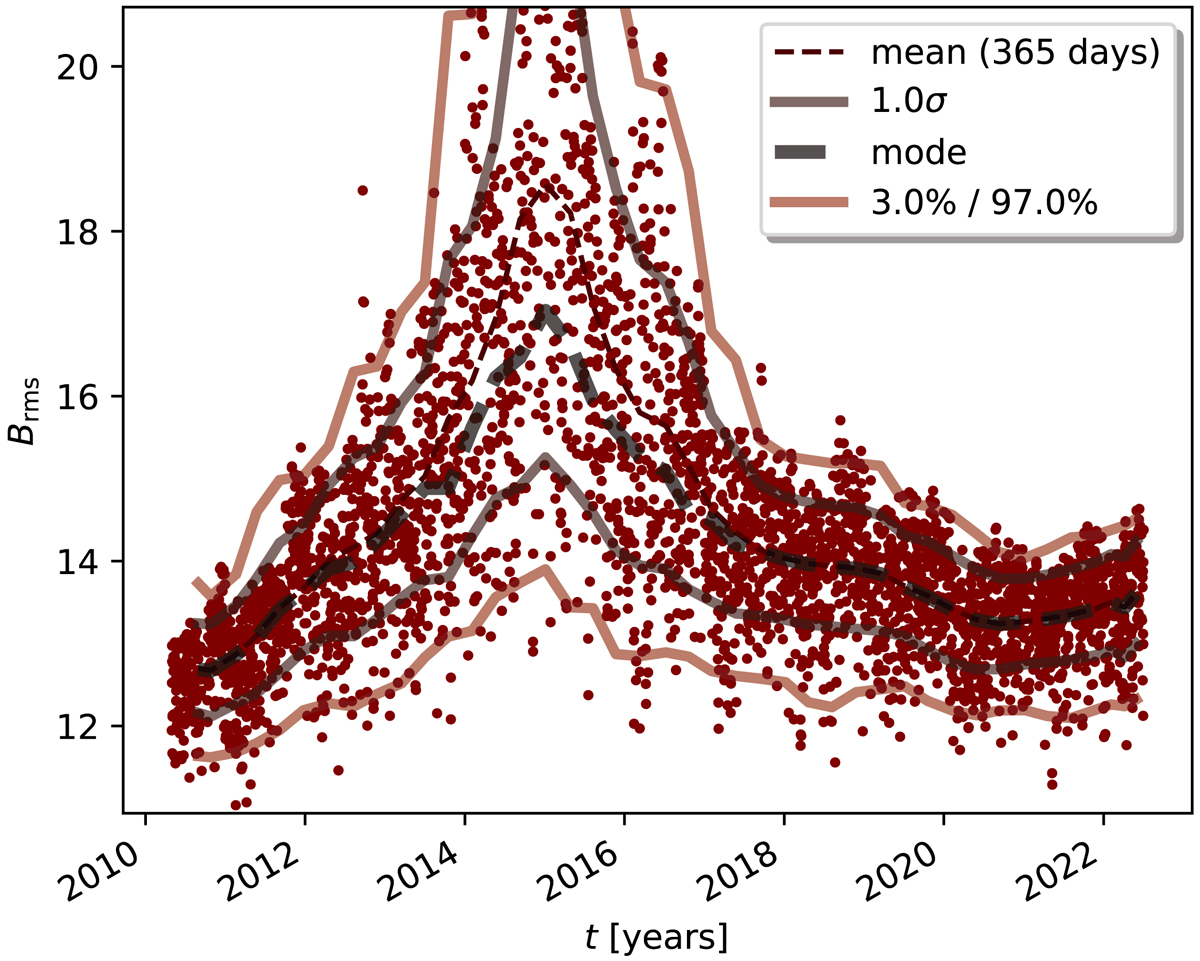
Fig. 5.
Download original image
Brms determined from the most quiet patches from 2010 to 2022 at disk center. The patches of 15° size in longitude and latitude contain network and internetwork fields. The solid red lines display the 97% percentile level, the dashed gray line the mode of a log-normal fit to yearly-binned data moved in a sliding window of 100 days length. For all values of ω, the magnitude of P is always an order of magnitude higher than the noise level outside the considered location of the ring.
Current usage metrics show cumulative count of Article Views (full-text article views including HTML views, PDF and ePub downloads, according to the available data) and Abstracts Views on Vision4Press platform.
Data correspond to usage on the plateform after 2015. The current usage metrics is available 48-96 hours after online publication and is updated daily on week days.
Initial download of the metrics may take a while.