Fig. 3.
Download original image
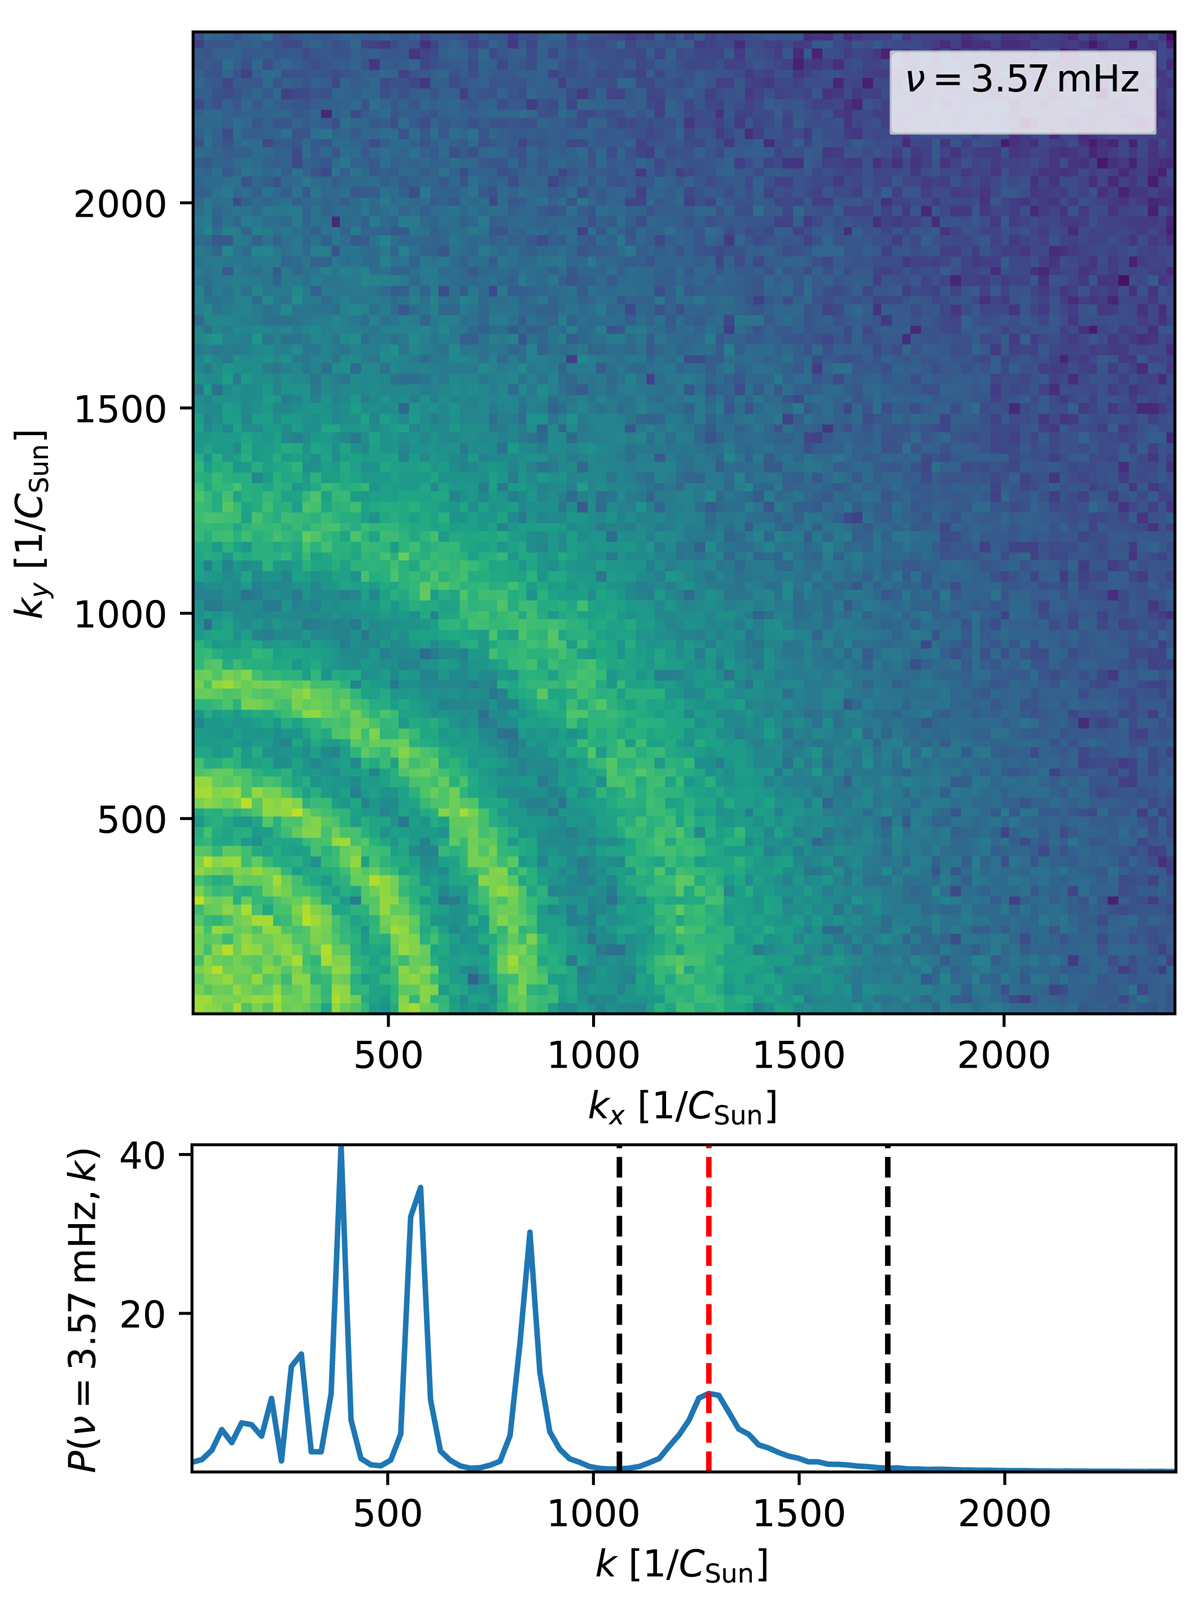
Examples of a typical QS f-mode spectra. Top: example of QS ring diagram at the angular frequency ν = 3.57 mHz for one quadrant of the full ring (logarithmic color scale), computed from the data cube presented in Fig. 4 (left panel). Bottom: collapsed spectrum obtained by integrating over the ring diagram. The red vertical line marks the position of the maximum of the f-mode and the black vertical lines the range of integration. The wavenumber k is expressed in units of the circumference of the Sun (CSun).
Current usage metrics show cumulative count of Article Views (full-text article views including HTML views, PDF and ePub downloads, according to the available data) and Abstracts Views on Vision4Press platform.
Data correspond to usage on the plateform after 2015. The current usage metrics is available 48-96 hours after online publication and is updated daily on week days.
Initial download of the metrics may take a while.