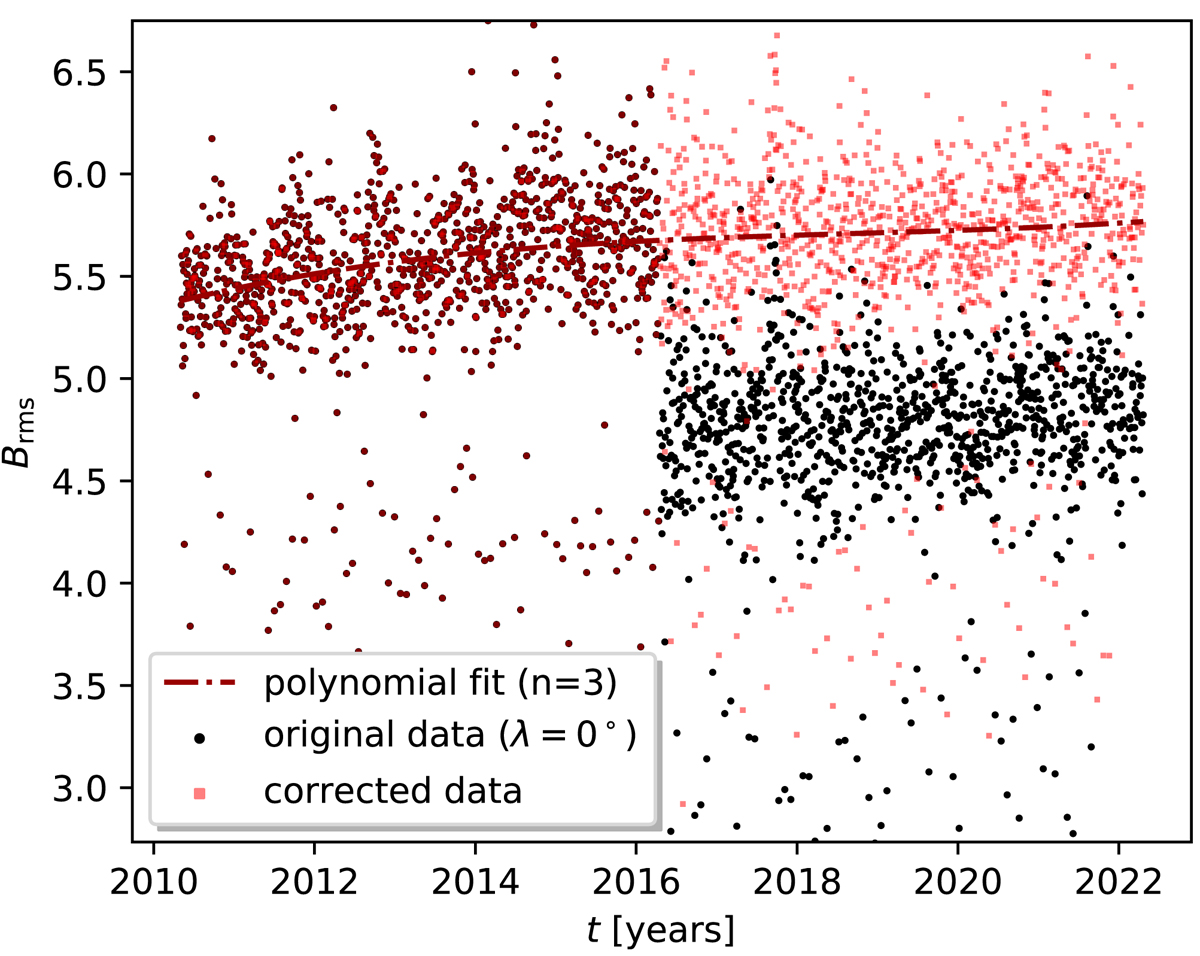
Fig. 2.
Download original image
Determination of the correction for the HMI sensitivity change: observing mode change on 13 Apr. 2016 causes a discontinuity in the level of Brms values of the internetwork data. The original data are displayed with the dark red and black dots, the corrected data with the light red dots. The dashed line indicates the polynomial fit of a degree of 3 used to obtain the offset.
Current usage metrics show cumulative count of Article Views (full-text article views including HTML views, PDF and ePub downloads, according to the available data) and Abstracts Views on Vision4Press platform.
Data correspond to usage on the plateform after 2015. The current usage metrics is available 48-96 hours after online publication and is updated daily on week days.
Initial download of the metrics may take a while.