Fig. 1.
Download original image
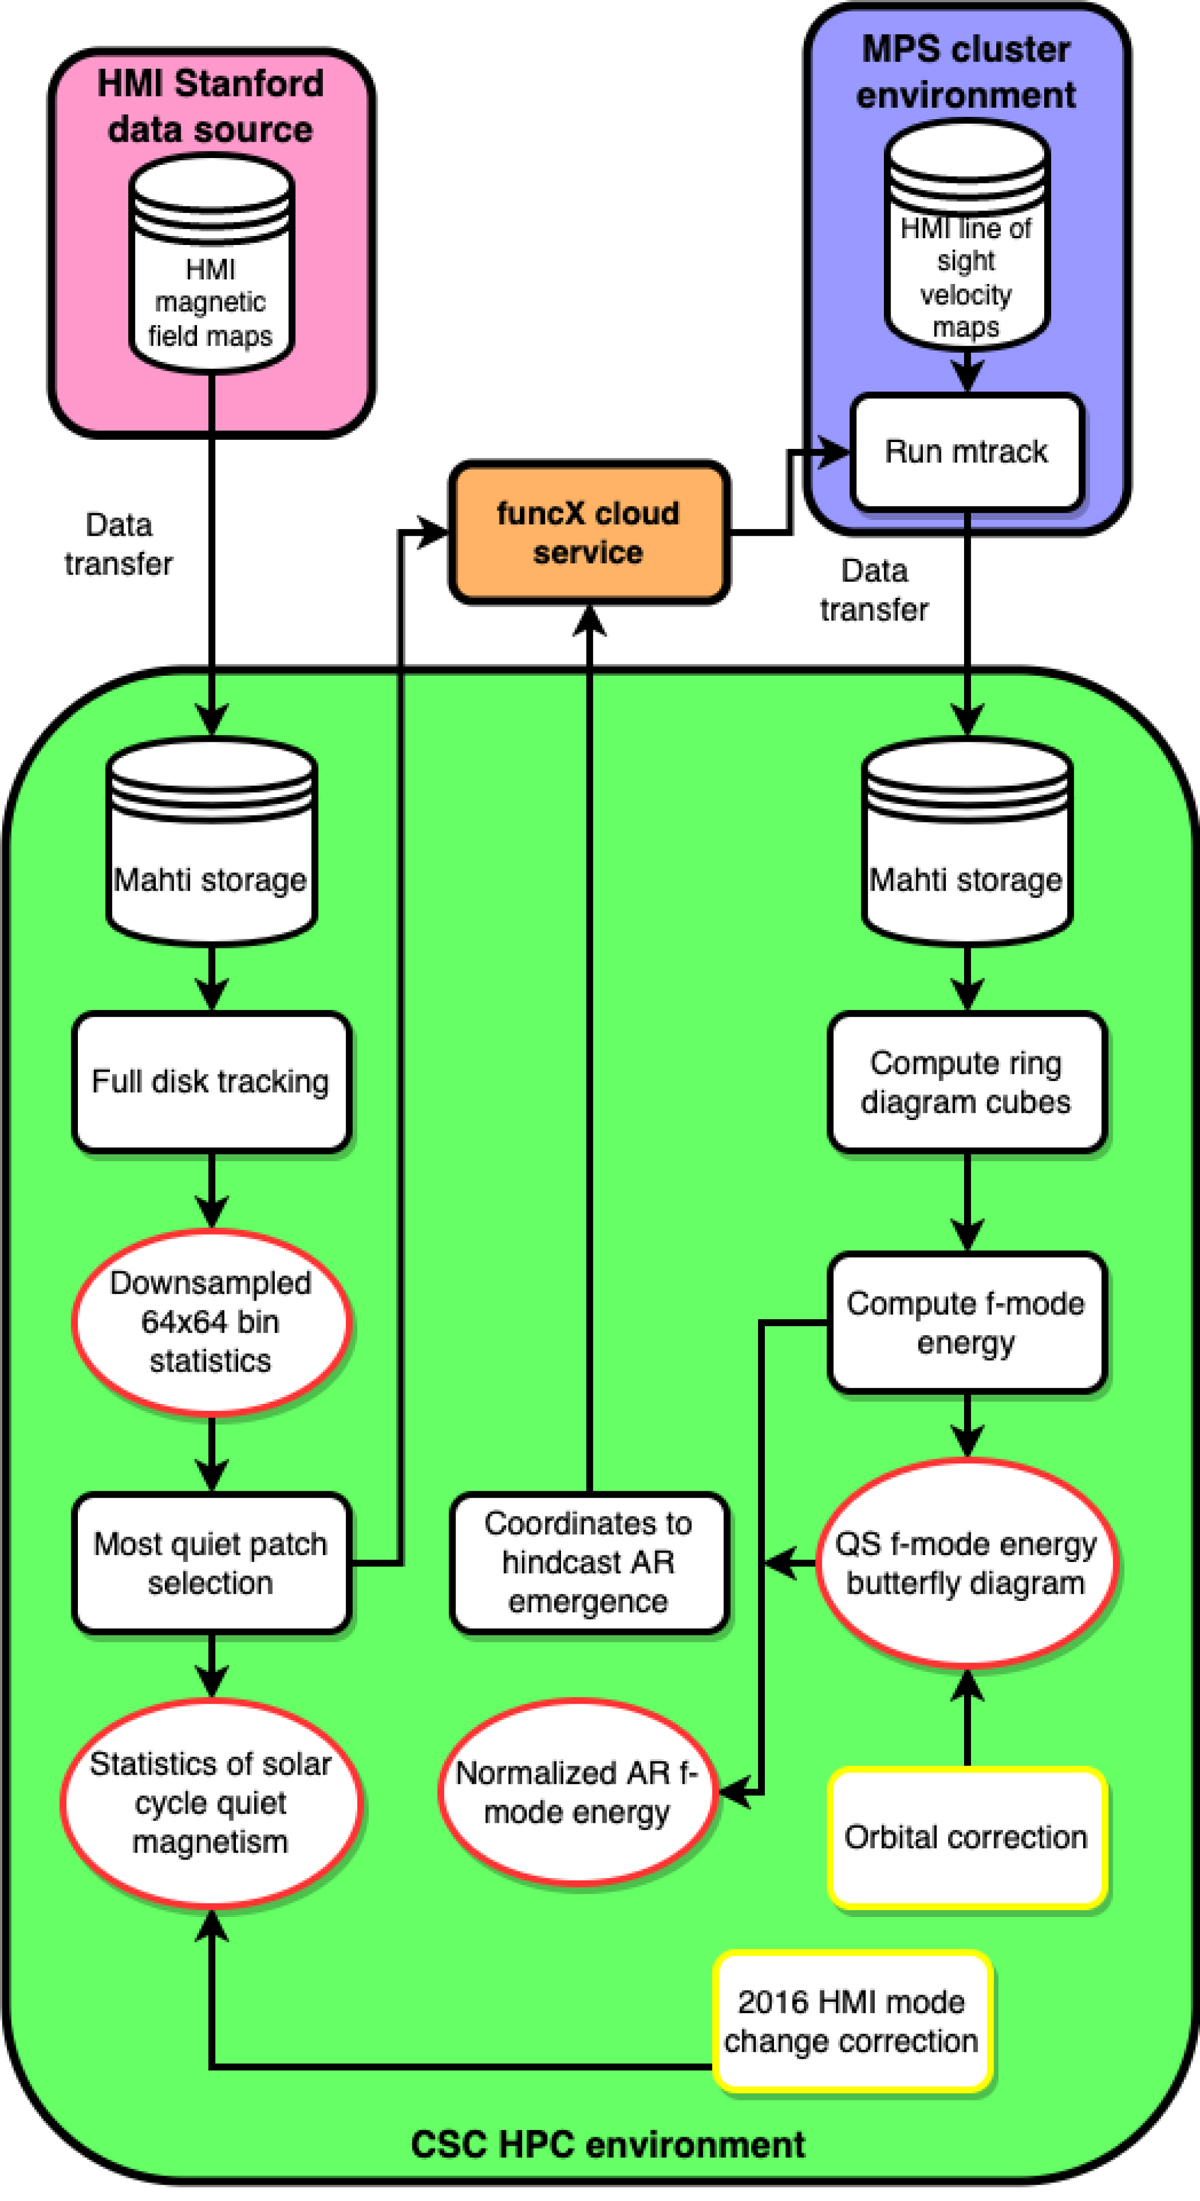
Data pipeline deployed in the CSC HPC environment. The leftmost tree illustrates the pipeline to collect the magnetograms in the most quiet patches, while the rightmost one the pipeline to track data from the quiet patches from the HMI database, and compute the f-mode energy. The central path of AR processing is otherwise equivalent to the QS pipeline, but their AR coordinates are sent for tracking in the MPS (in Germany) cluster environment, followed by an additional step, namely, QS calibration, at the end. Rectangular boxes represent analysis functions and ellipsoids are the derived data products. The rectangles with yellow frames stand for the corrective functions applied to the data.
Current usage metrics show cumulative count of Article Views (full-text article views including HTML views, PDF and ePub downloads, according to the available data) and Abstracts Views on Vision4Press platform.
Data correspond to usage on the plateform after 2015. The current usage metrics is available 48-96 hours after online publication and is updated daily on week days.
Initial download of the metrics may take a while.