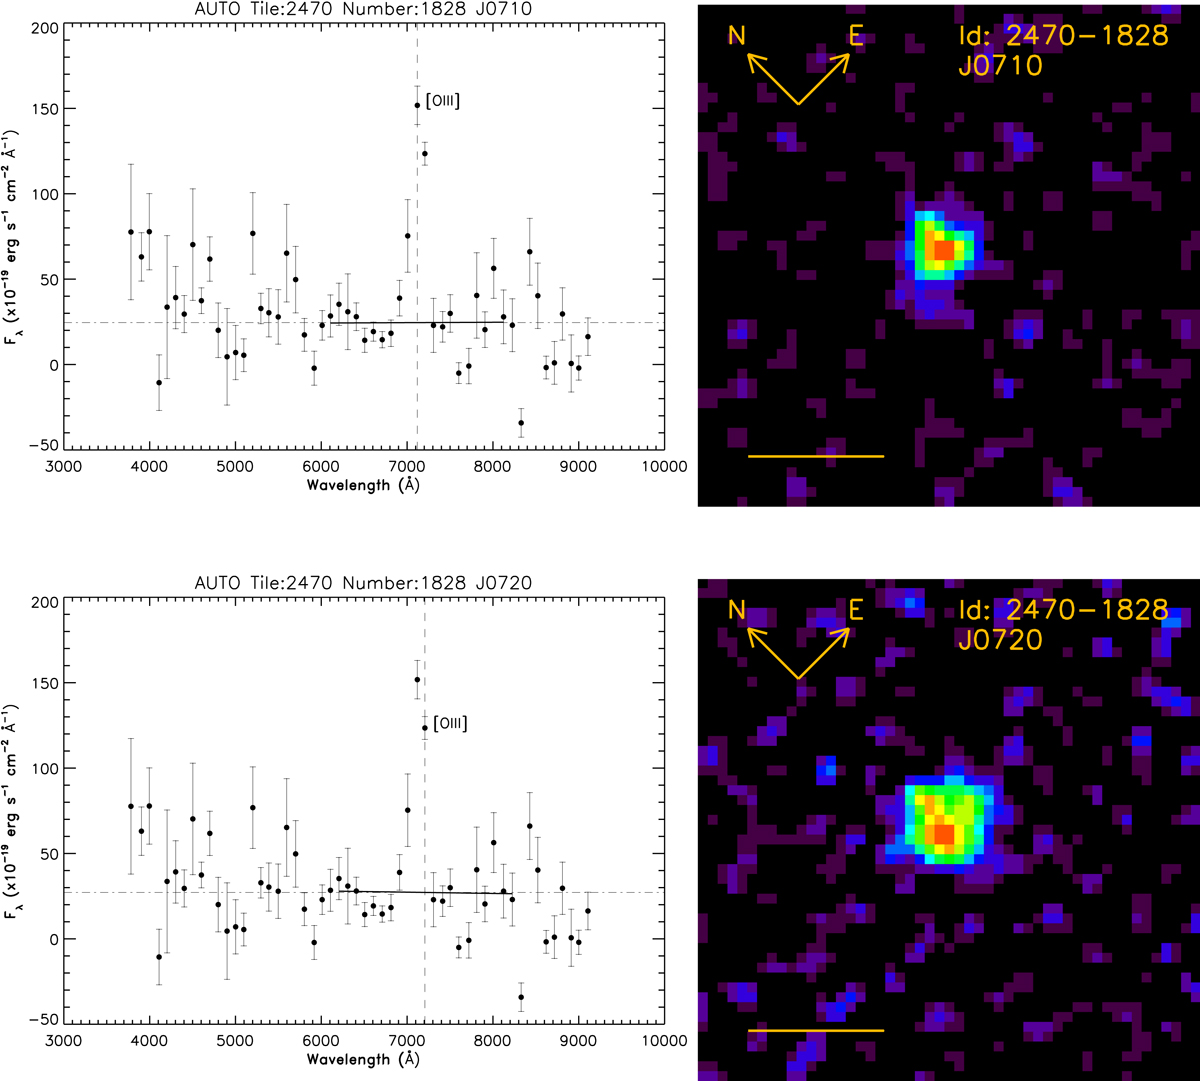
Fig. A.1.
Download original image
Data products from miniJPAS for the EELG candidates. Left: J-spectra using the AUTO fluxes. The vertical dashed line indicates the central wavelength of the selection filter. The solid line shows the fit to the continuum. The horizontal dot-dashed line corresponds to the continuum at the central wavelength of the selection filter. The emission line fulfilling our EW0 condition is indicated to the right of the vertical line. Right: Cutouts of the image corresponding to the selection filter. The length of the horizontal orange line corresponds to 3”.
Current usage metrics show cumulative count of Article Views (full-text article views including HTML views, PDF and ePub downloads, according to the available data) and Abstracts Views on Vision4Press platform.
Data correspond to usage on the plateform after 2015. The current usage metrics is available 48-96 hours after online publication and is updated daily on week days.
Initial download of the metrics may take a while.