Fig. 5.
Download original image
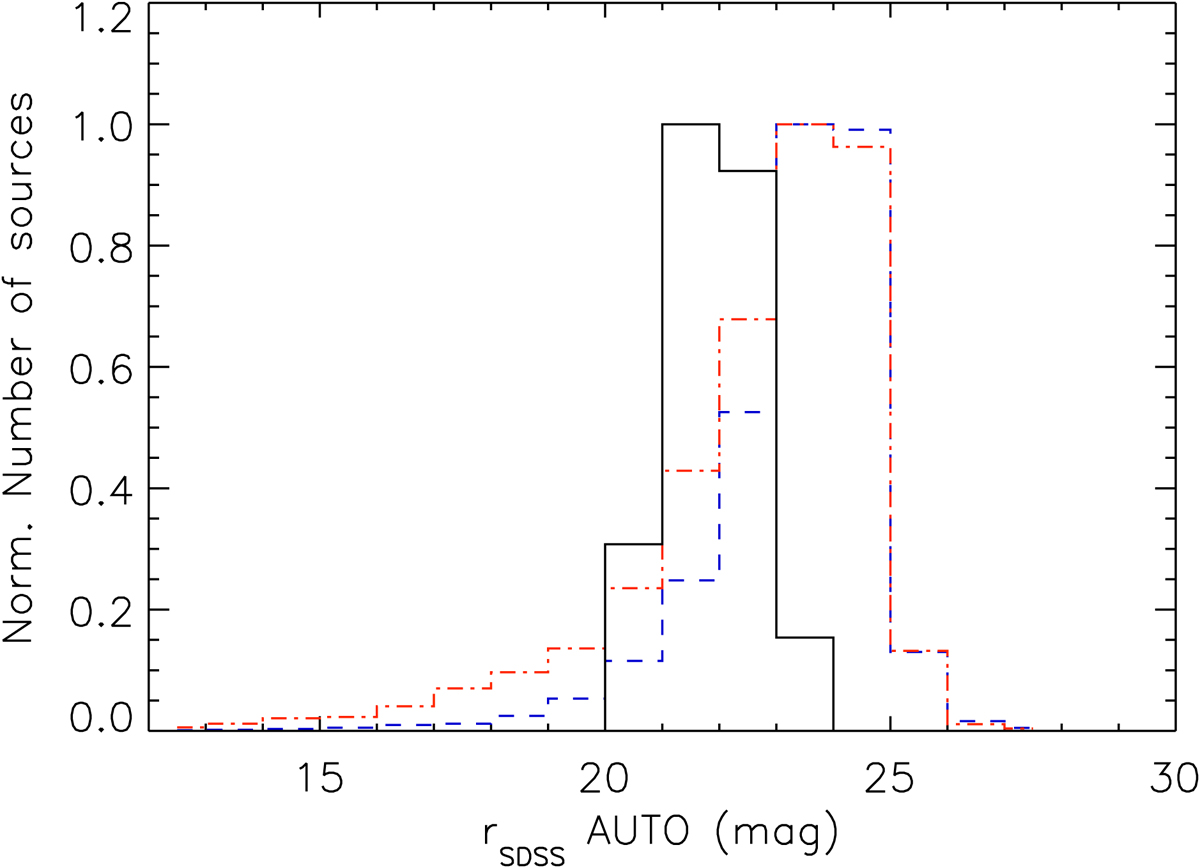
Histogram of the rSDSS (AUTO photometry) magnitude of our selected candidates (black line). Blue and red histograms correspond to the total sample of galaxies and stars in the miniJPAS dual catalogue, respectively, classified taking into account the miniJPAS stellarity index. The three histograms are normalized to the peak of each distribution.
Current usage metrics show cumulative count of Article Views (full-text article views including HTML views, PDF and ePub downloads, according to the available data) and Abstracts Views on Vision4Press platform.
Data correspond to usage on the plateform after 2015. The current usage metrics is available 48-96 hours after online publication and is updated daily on week days.
Initial download of the metrics may take a while.