Fig. 2.
Download original image
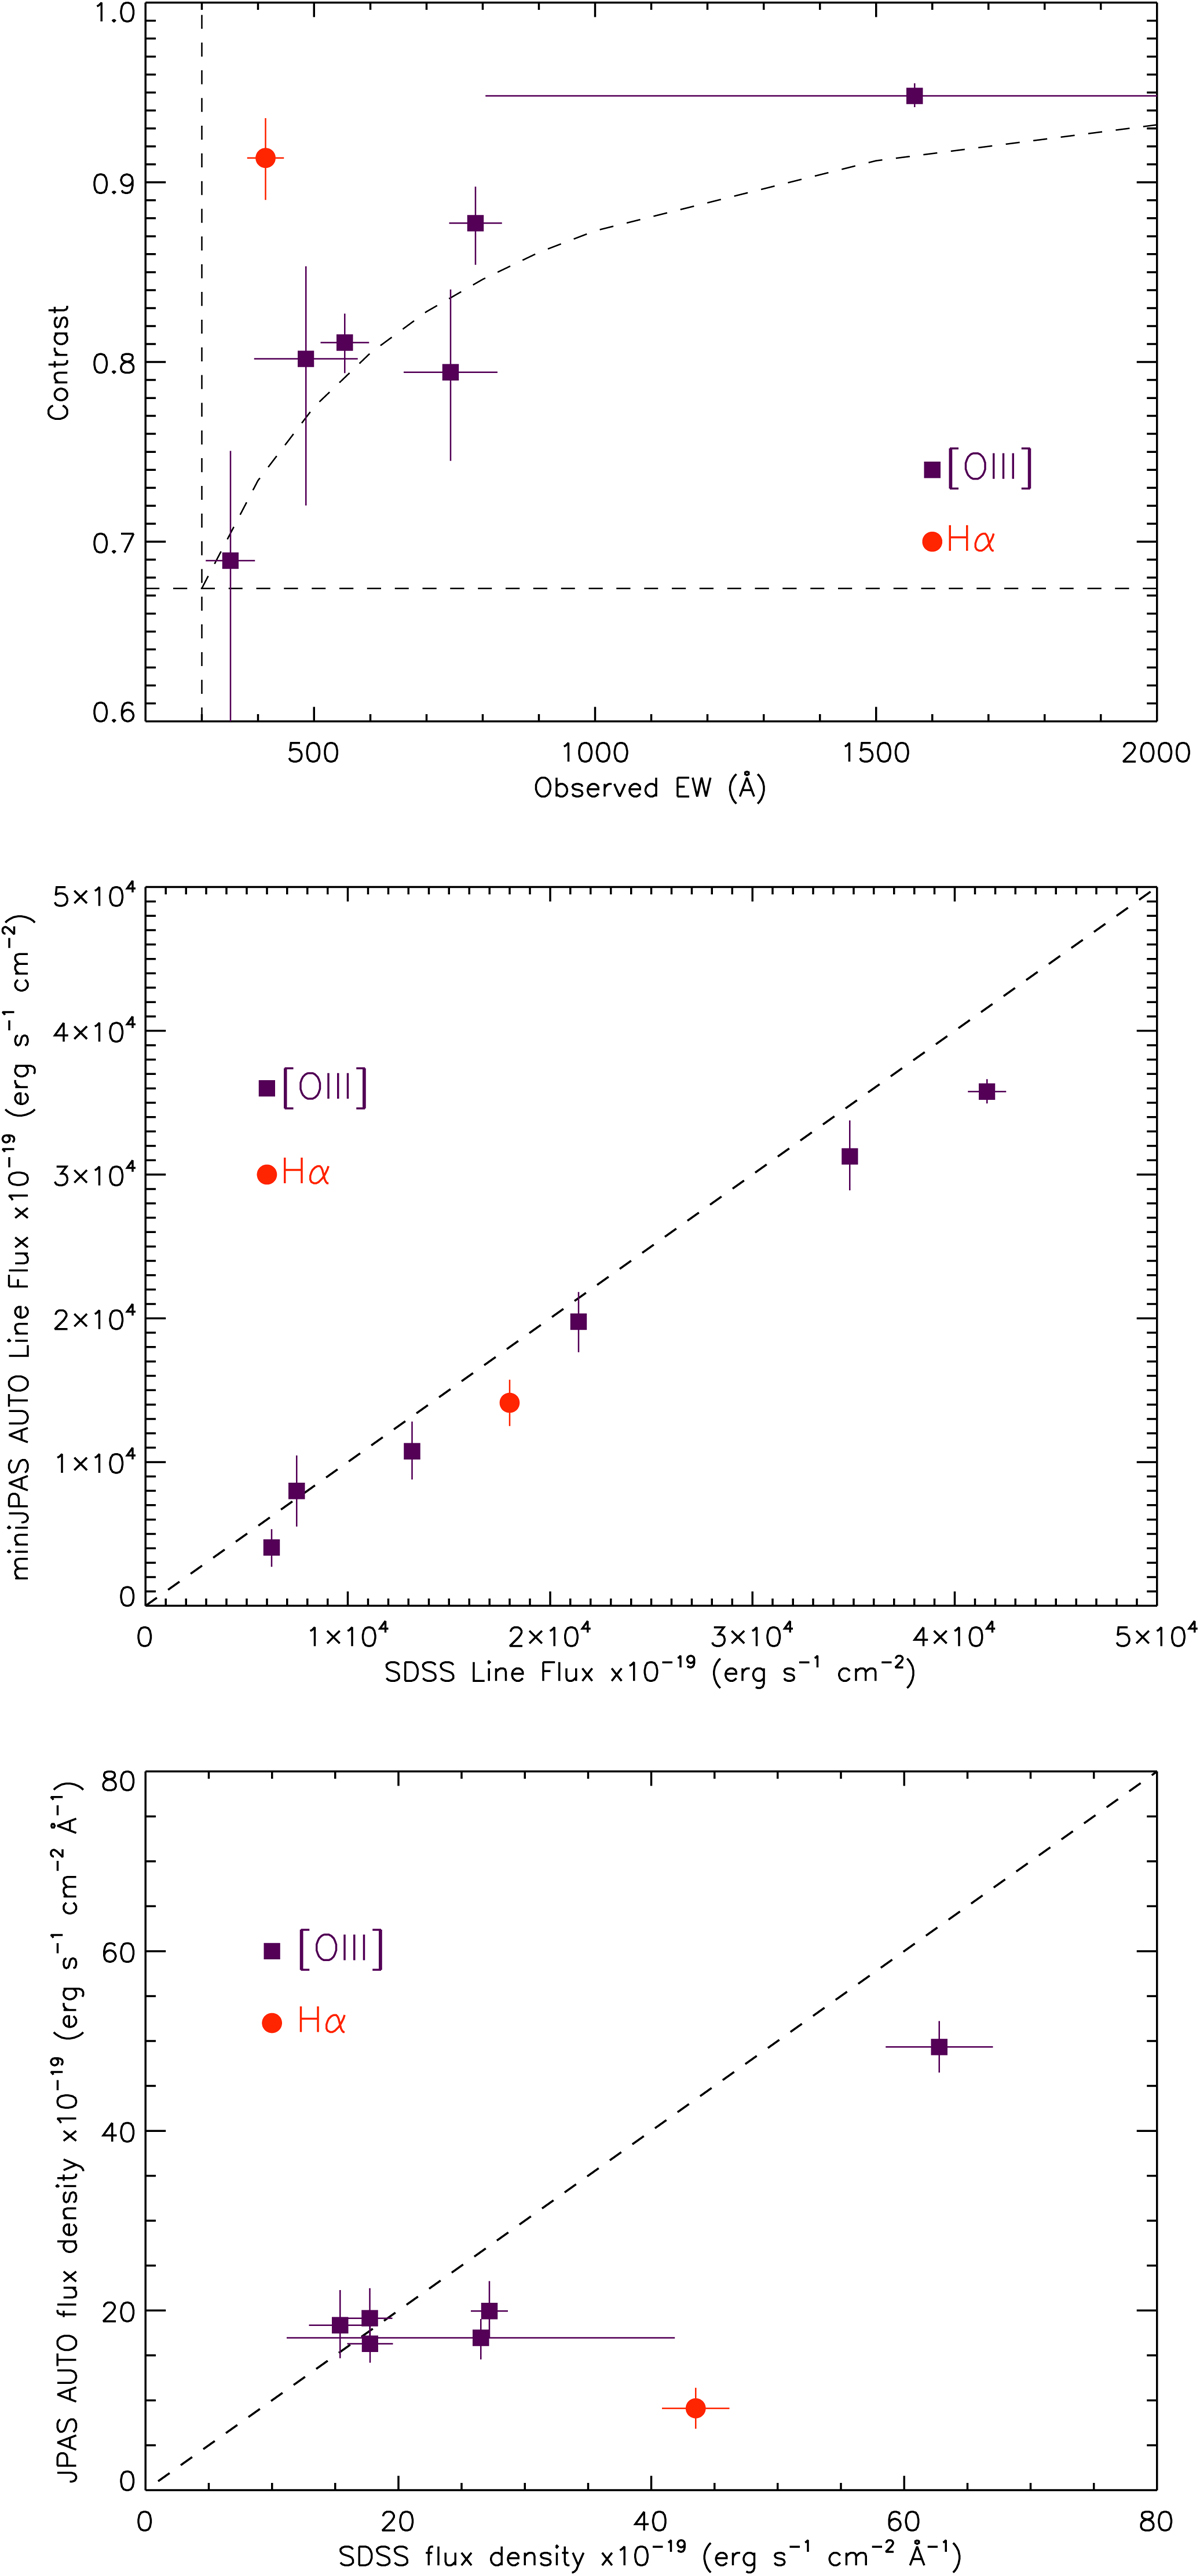
Comparison of quantities derived from miniJPAS data and from the SDSS spectra. Top: contrast derived from the miniJPAS data as a function of the observed EW measured from the SDSS spectra for the SDSS galaxies showing emission lines with observed EW larger than 300 Å. The vertical and horizontal dashed lines correspond to our lower limits in the observed EW and the Contrast, respectively. The curved dashed line corresponds to the theoretical relation between the observed EW and the Contrast. Middle: emission line fluxes derived from the miniJPAS data as a function of the fluxes measured from the SDSS spectra. The dashed line corresponds to the one-to-one relation. Bottom: continuum flux densities derived from the miniJPAS data as a function of the continuum flux densities measured from the SDSS spectra. The dashed line corresponds to the one-to-one relation.
Current usage metrics show cumulative count of Article Views (full-text article views including HTML views, PDF and ePub downloads, according to the available data) and Abstracts Views on Vision4Press platform.
Data correspond to usage on the plateform after 2015. The current usage metrics is available 48-96 hours after online publication and is updated daily on week days.
Initial download of the metrics may take a while.