Fig. 4.
Download original image
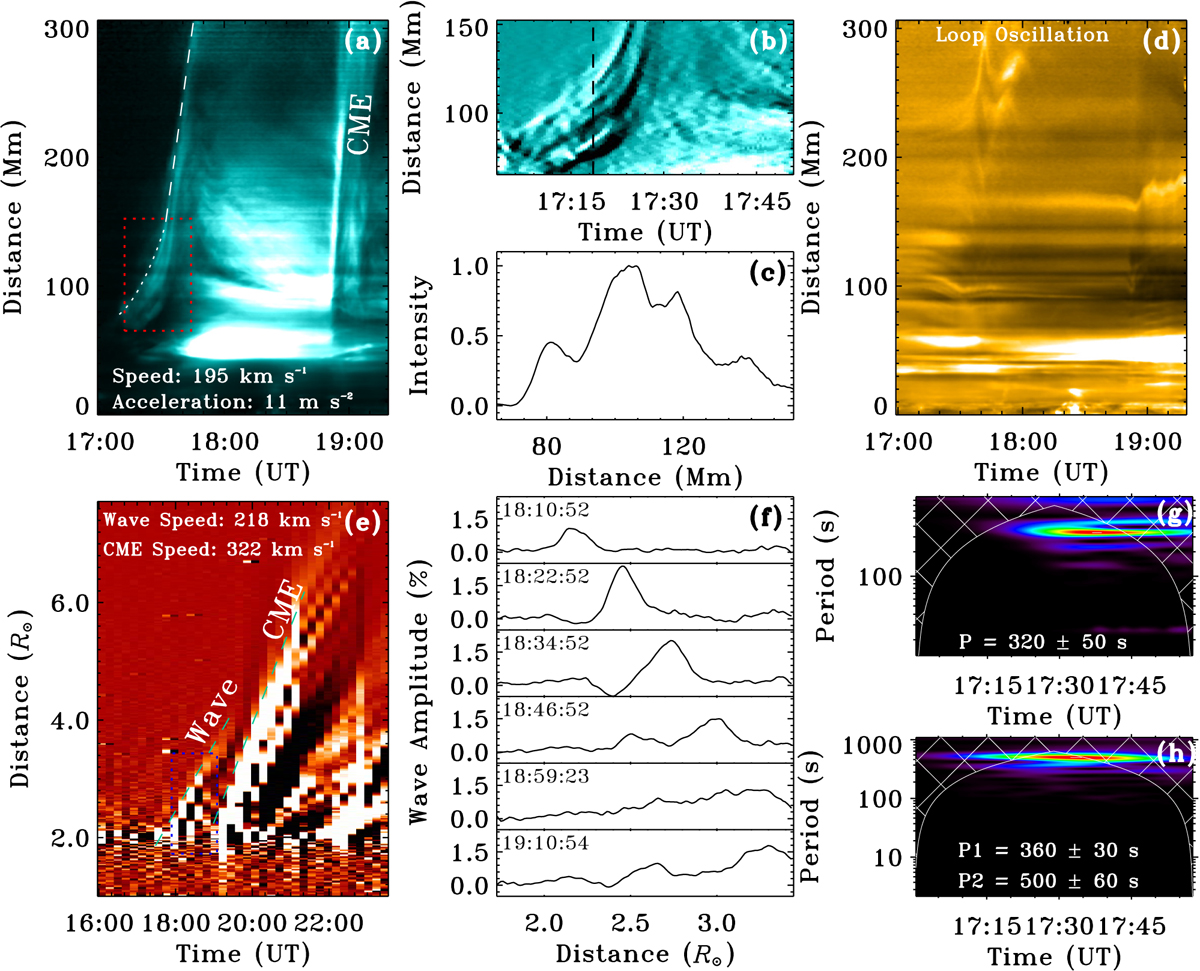
Kinematics and periodic analysis of the expanding loops, the wave train, and the flare. Panel a shows the time–distance plot made from AIA 131 Å images along the black dashed line as shown in Fig. 3c. Panel b shows the time–distance plot within the red box region in panel a, which is made from the AIA 131 Å running-difference images. The running-difference intensity profile along the dashed black line in panel b is plotted in panel c. Panel d is the same as a, but is made from AIA 171 Å images. Panel e is the time–distance made from LASCO/C2 running-difference images along the same path as panel a, and panel f shows the intensity profiles at difference times within the blue dotted box in panel e. Panel g is the wavelet spectrum generated using the intensity profile as shown in panel c, while panel h is generated using the time derivative of the GOES 1–8 Å flux.
Current usage metrics show cumulative count of Article Views (full-text article views including HTML views, PDF and ePub downloads, according to the available data) and Abstracts Views on Vision4Press platform.
Data correspond to usage on the plateform after 2015. The current usage metrics is available 48-96 hours after online publication and is updated daily on week days.
Initial download of the metrics may take a while.