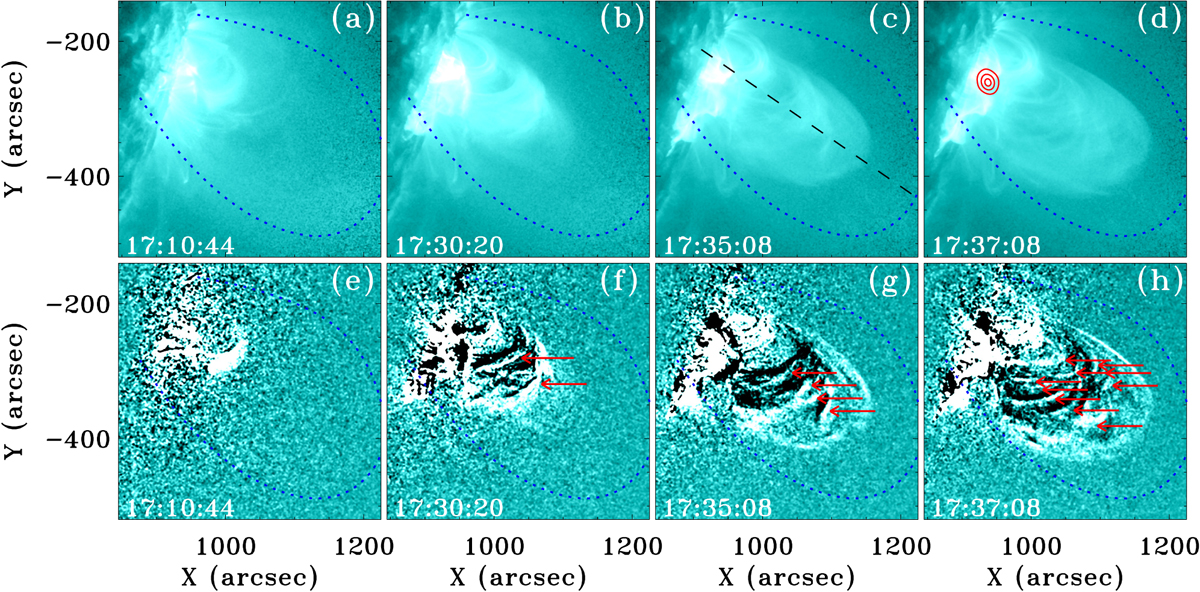
Fig. 3.
Download original image
AIA 131 Å images showing the eruption in the source region. The top row shows the direct time sequence images, while the bottom row shows the corresponding based-difference images. The dashed blue curve in each panel shows the position of the high-lying loop system at 17:12:18 UT (see Fig. 2b). The red contours in panel d show the RHESSI hard-X-ray source in the energy band of 12–25 KeV. The red arrows in panels f–h indicate the outward expanding reconnected loops.
Current usage metrics show cumulative count of Article Views (full-text article views including HTML views, PDF and ePub downloads, according to the available data) and Abstracts Views on Vision4Press platform.
Data correspond to usage on the plateform after 2015. The current usage metrics is available 48-96 hours after online publication and is updated daily on week days.
Initial download of the metrics may take a while.