Fig. 2.
Download original image
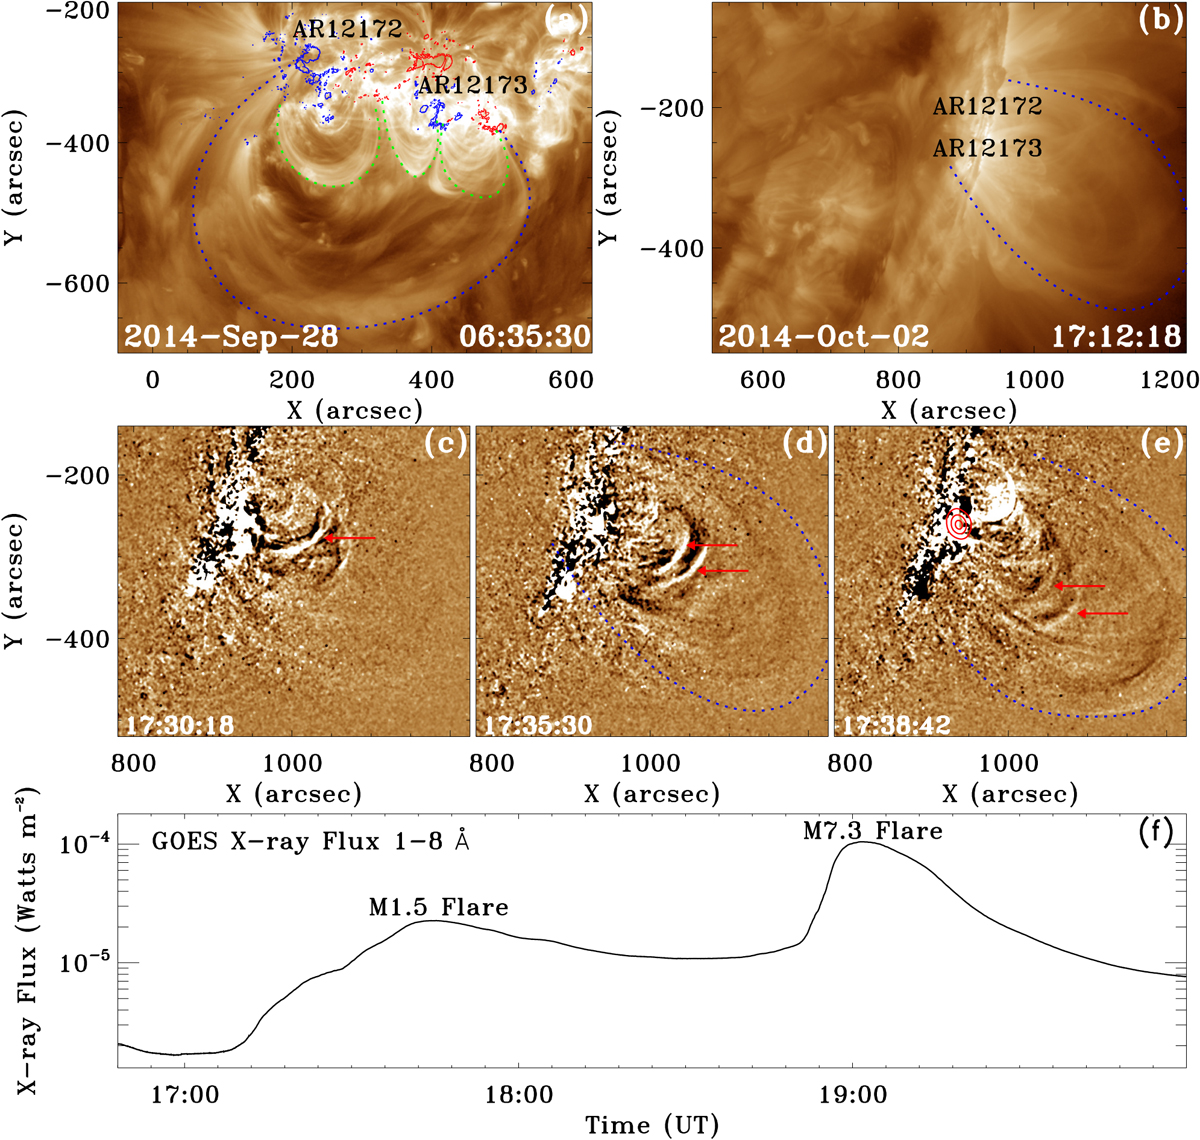
Eruption in the AIA 193 Å images and soft-X-ray lightcurve recorded by the GOES. Panel a is an AIA 193 Å image on 2014 September 28 when AR12172 was on the solar disk, in which the red and blue contours indicate the positive and negative magnetic polarities, respectively. The three green dotted curves outline the three low-lying loop systems, while the large blue one indicates the high-lying loop system (the same in other panels). Panel b is an AIA 193 Å image before the eruption. Panels c–e show the eruption process of the event, in which the red circles in panel e show the contours of the RHESSI hard-X-ray source in the 12–25 KeV energy band, and the red arrows indicate the newly formed expanding loops. Panel f shows the soft-X-ray flux recorded by the GOES in the energy band of 1–8 Å, in which the two flares are indicated.
Current usage metrics show cumulative count of Article Views (full-text article views including HTML views, PDF and ePub downloads, according to the available data) and Abstracts Views on Vision4Press platform.
Data correspond to usage on the plateform after 2015. The current usage metrics is available 48-96 hours after online publication and is updated daily on week days.
Initial download of the metrics may take a while.