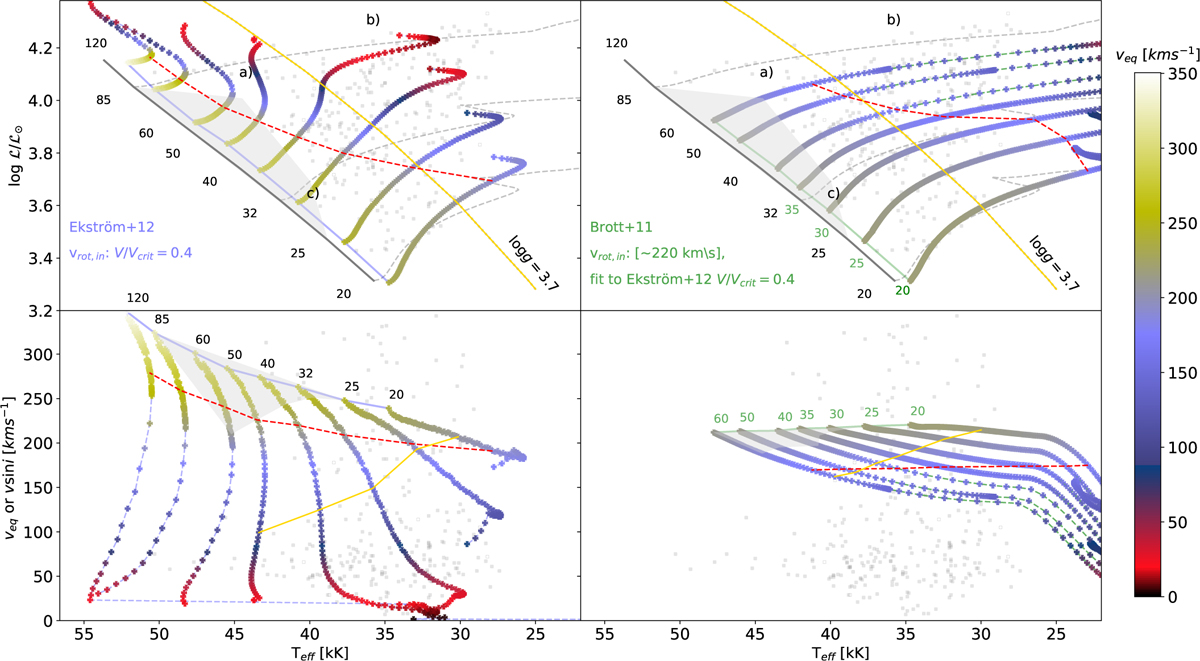
Fig. 9
Download original image
Predicted behavior of the equatorial rotational velocity in the single star evolutionary models, with rotation computed by Ekström et al. (2012, left panels) and Brott et al. (2011, right panels). See Sect. 4.1 for an explanation of the selected values of initial rotational velocity in each set of models. Cross symbols represent time steps in each evolutionary tracks, colored accordingly to the corresponding veq. The dashed red line marks the point in each track with a 20% reduction of veq from vini, and the yellow line indicates the log g = 3.7 dex line of constant gravity. Observations are represented by gray points. The shaded gray area highlights the area in the sHRD close to the ZAMS, which is void of observed stars. Top panels: Considered evolutionary tracks in the sHRD, where we also depict the ZAMS and the 20, 32, and 85 M⊙ evolutionary tracks corresponding to Ekström+12 models without rotation to better identify the three regions in the sHRD (marked as “a”, “b”, and “c”, respectively) discussed in Sects. 3.5 and 4.1 (see also Figs. 8 and 10). Bottom panels: Considered evolutionary tracks in the veq − Teff diagram (or v sin i–Teff for the case of the observations).
Current usage metrics show cumulative count of Article Views (full-text article views including HTML views, PDF and ePub downloads, according to the available data) and Abstracts Views on Vision4Press platform.
Data correspond to usage on the plateform after 2015. The current usage metrics is available 48-96 hours after online publication and is updated daily on week days.
Initial download of the metrics may take a while.