Open Access
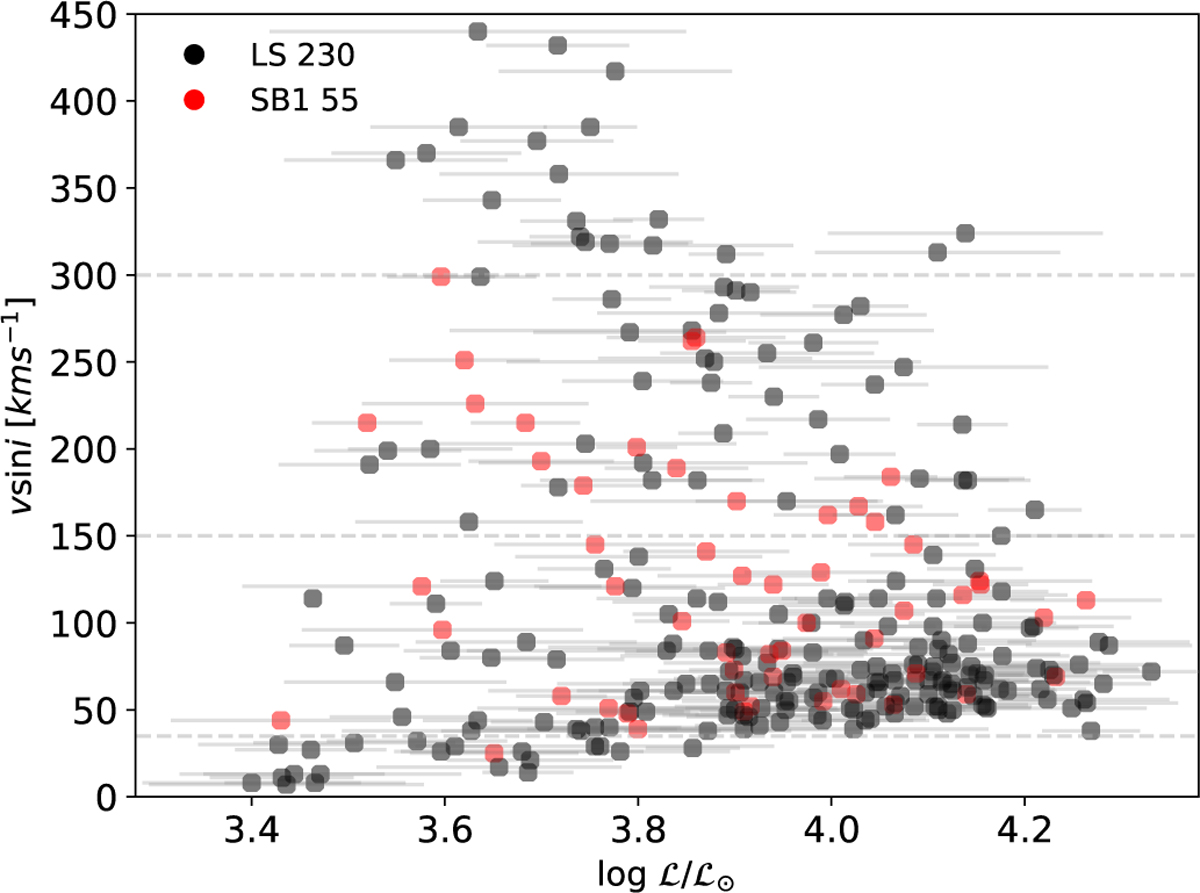
Fig. 7
Download original image
v sin i–log(L/L⊙) diagram including our working sample of stars. The LS and SB1 subsamples are highlighted in black and red, respetively. The v sin i = 35, 150, and 300 km s−1 values are highlighted for reference purposes (see Sect. 3.4).
Current usage metrics show cumulative count of Article Views (full-text article views including HTML views, PDF and ePub downloads, according to the available data) and Abstracts Views on Vision4Press platform.
Data correspond to usage on the plateform after 2015. The current usage metrics is available 48-96 hours after online publication and is updated daily on week days.
Initial download of the metrics may take a while.