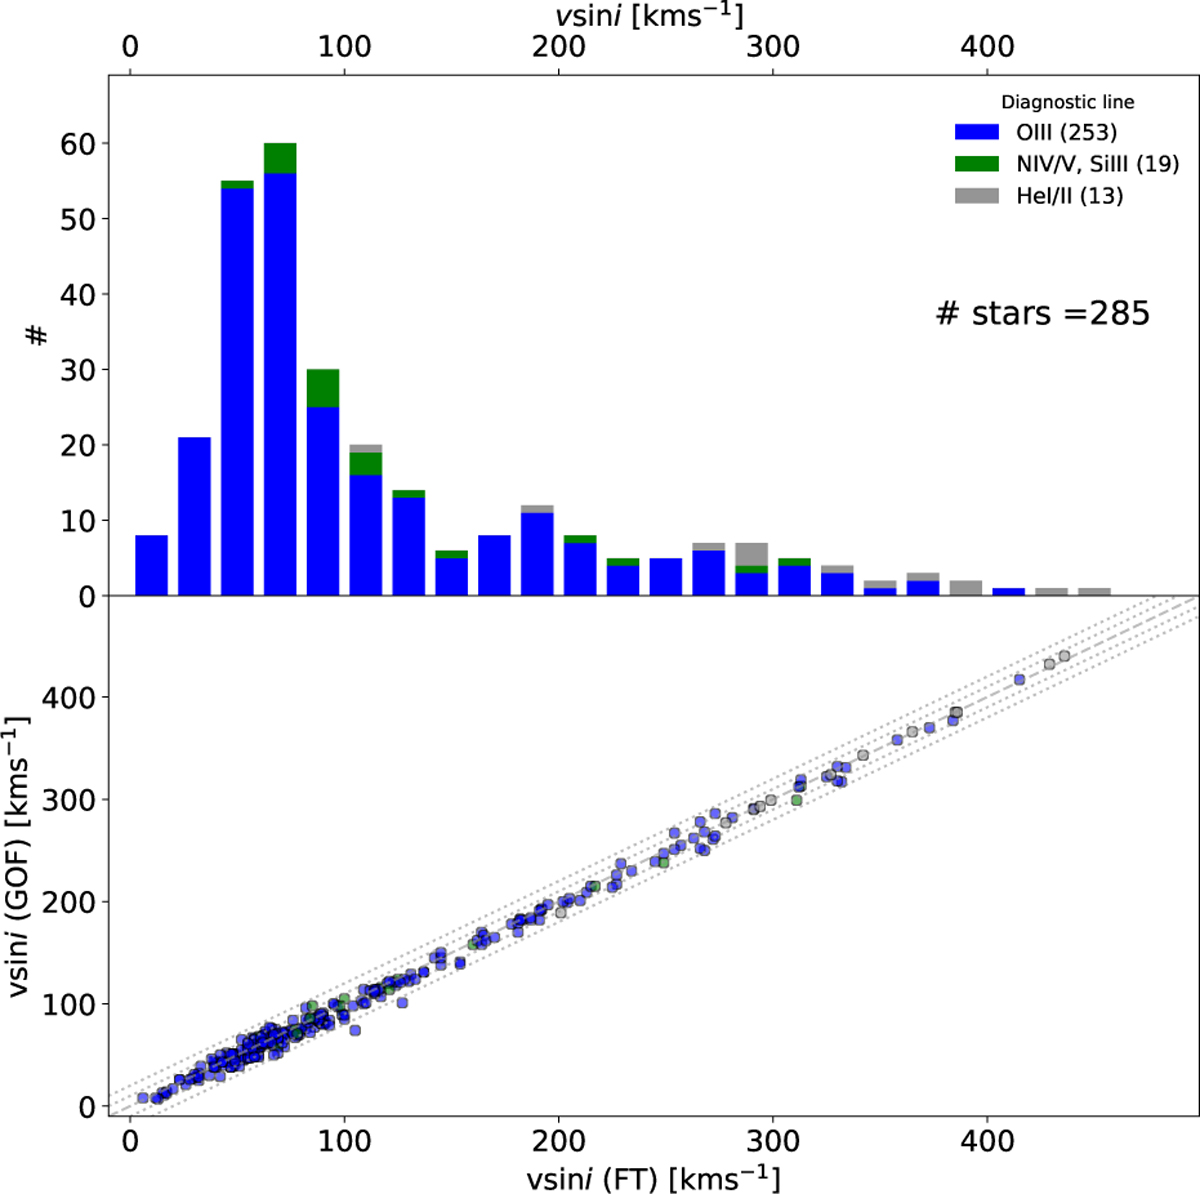
Fig. 2
Download original image
Rotational properties of the sample. Top: Histogram of υ sin i values resulting from the iacob-broad analysis of the 285 O-type stars in our working sample, highlighting the diagnostic line considered for the analysis. Bottom: Comparison of the v sin i estimates resulting from the FT and GOF analysis strategies. The diagonal dotted lines indicate differences between both quantities of ±10 and ±20 km s−1.
Current usage metrics show cumulative count of Article Views (full-text article views including HTML views, PDF and ePub downloads, according to the available data) and Abstracts Views on Vision4Press platform.
Data correspond to usage on the plateform after 2015. The current usage metrics is available 48-96 hours after online publication and is updated daily on week days.
Initial download of the metrics may take a while.