Fig. A.1
Download original image
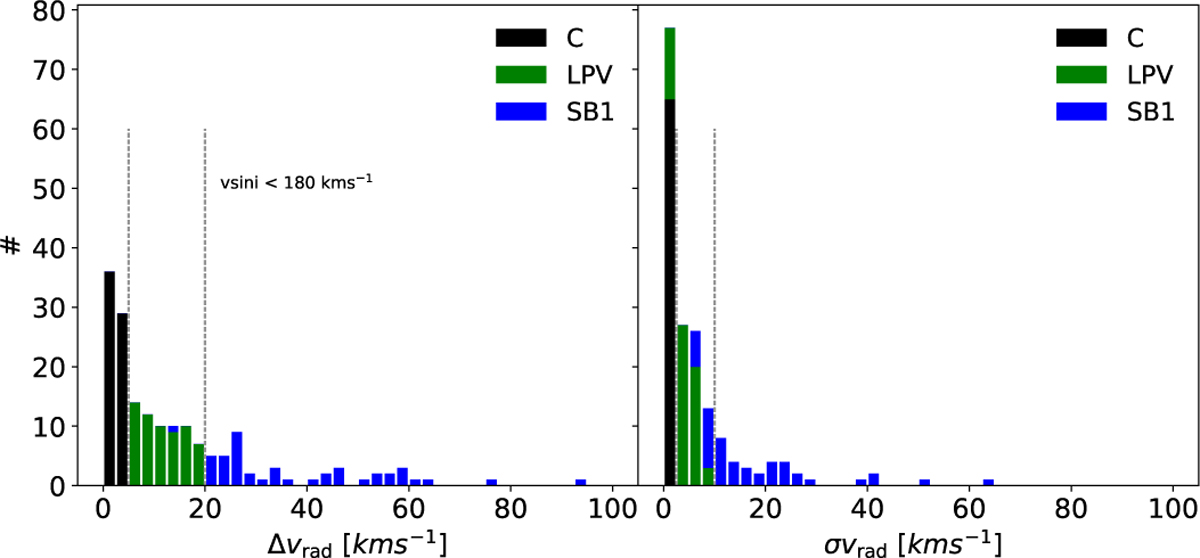
∆vrad (left) and σvrad (right) distributions for the O-type stars in our initial sample not identified as SB2s and having a v sin i≤ 180 km s−1. We indicate with different colors how the stars were finally classified as C/LPV/SB1 in the stars with more than one spectrum. Horizontal dashed lines indicate the thresholds considered to separate the stars in the three categories. For most stars, both indicators coincide. In case of divergence, the higher variability flag prevails (SB1, then LPV, and then C).
Current usage metrics show cumulative count of Article Views (full-text article views including HTML views, PDF and ePub downloads, according to the available data) and Abstracts Views on Vision4Press platform.
Data correspond to usage on the plateform after 2015. The current usage metrics is available 48-96 hours after online publication and is updated daily on week days.
Initial download of the metrics may take a while.