Fig. 11
Download original image
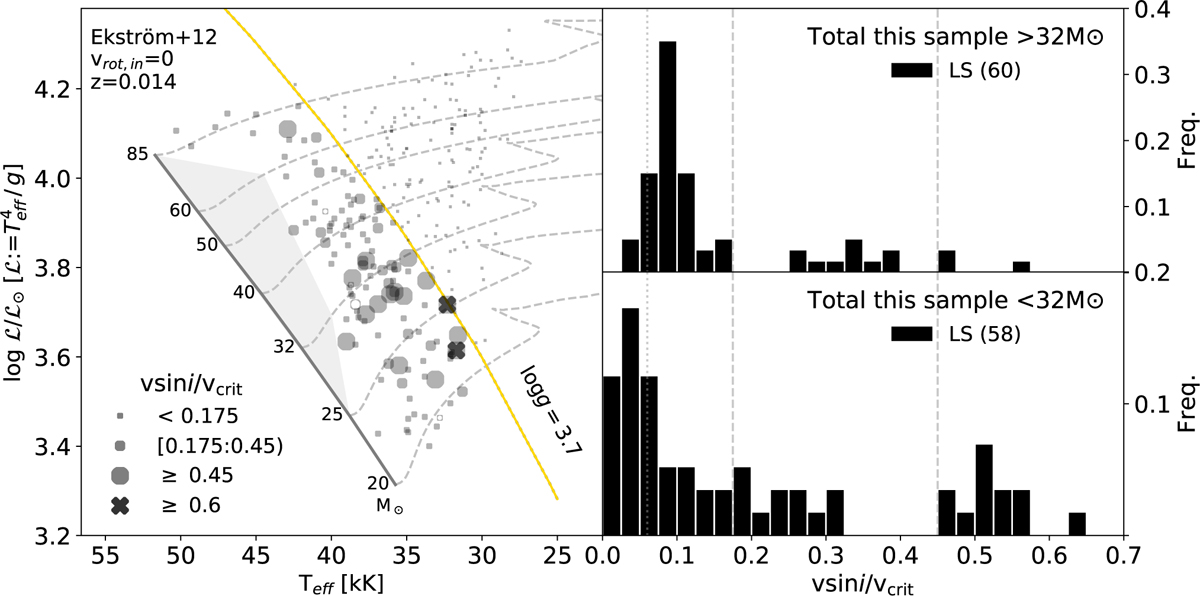
Properties of the supposed youngest stars in the sample. Left: sHRD highlighting a subsample of 118 LS O-type stars with log g > 3.7 dex. The symbol size depends on the value of the ratio v sin i/vcrit, as indicated. Right: υ sin i/vcrit distributions (as normalized histograms) for the indicated subsample, separating those stars located above (upper panel) and below (lower panel) the 32 M⊙ track. The vertical dashed lines mark several values of interest for the v sin i/vcrit ratio (see text for explanation). The vertical dotted line at v sin i/vcrit = 0.06 marks the approximate limit below which the v sin i determination can be affected by methodological limitations in those stars located above the 32 M0 track).
Current usage metrics show cumulative count of Article Views (full-text article views including HTML views, PDF and ePub downloads, according to the available data) and Abstracts Views on Vision4Press platform.
Data correspond to usage on the plateform after 2015. The current usage metrics is available 48-96 hours after online publication and is updated daily on week days.
Initial download of the metrics may take a while.