Fig. 10
Download original image
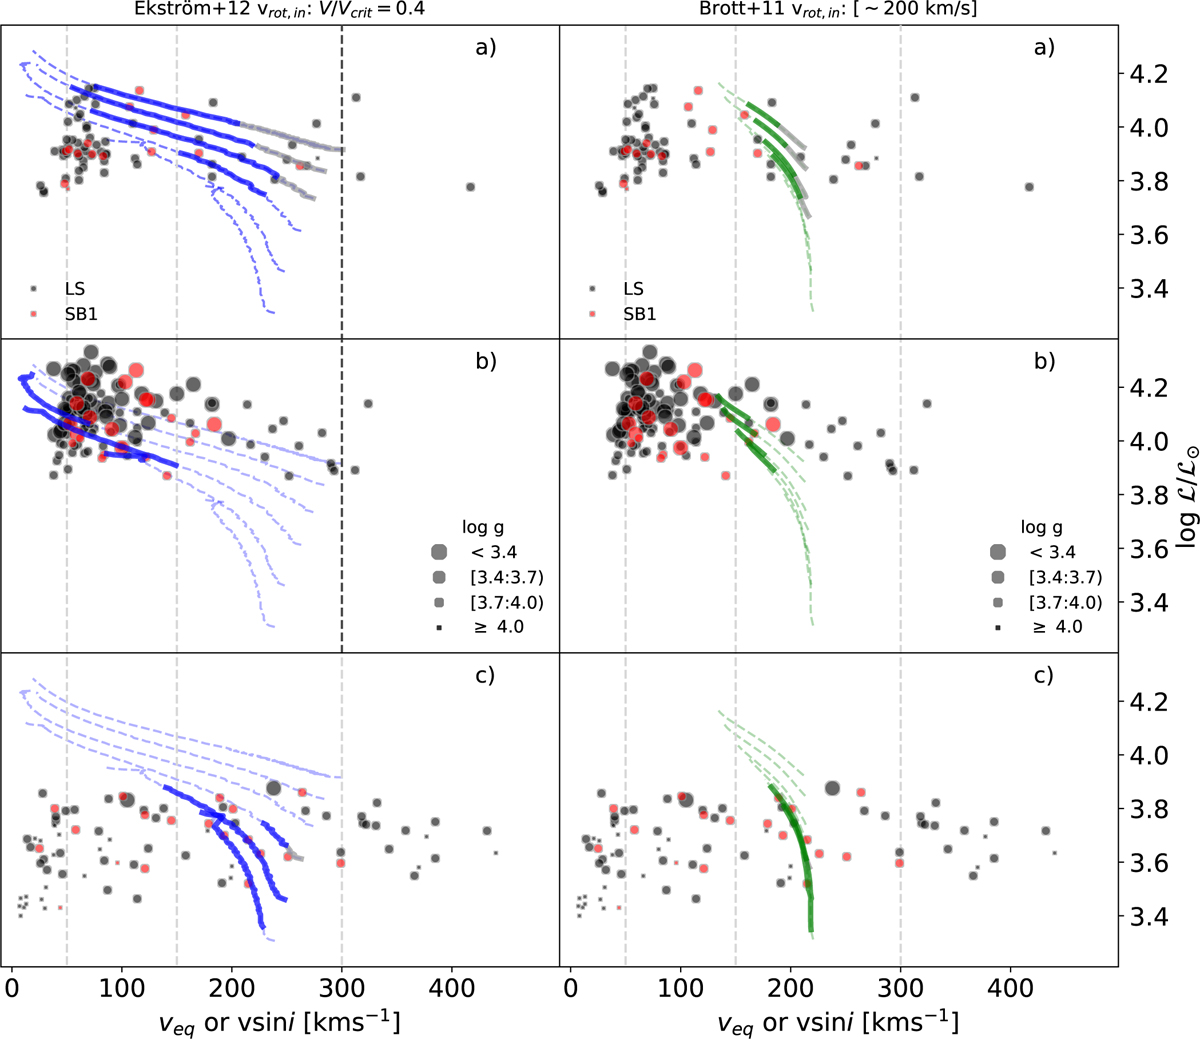
Predicted behavior of the evolutionary tracks computed by Ekström et al. (2012, left panels) and Brott et al. (2011, right panels) in the Oeq-log (L/L⊙) diagram. From top to bottom, the sections of the evolutionary tracks, which are located within the three regions (“a”, “b”, and “c”, respectively) indicated in Fig. 8 and described in Sect. 3.5, are highlighted with blue and green thicker lines. In addition, the gray thick part of the evolutionary tracks indicates that the corresponding section of the track lies inside the region of the sHRD close to the ZAMS where no O stars are detected. The stars in the observed sample that populate the three considered regions of the sHRD are also included in each panel, separately, for comparison (this time using v sin i values instead of veq). As in other figures, we indicate three v sin i values of interest (50, 150, and 300 km s−1) with vertical lines. Size represents log q value.
Current usage metrics show cumulative count of Article Views (full-text article views including HTML views, PDF and ePub downloads, according to the available data) and Abstracts Views on Vision4Press platform.
Data correspond to usage on the plateform after 2015. The current usage metrics is available 48-96 hours after online publication and is updated daily on week days.
Initial download of the metrics may take a while.