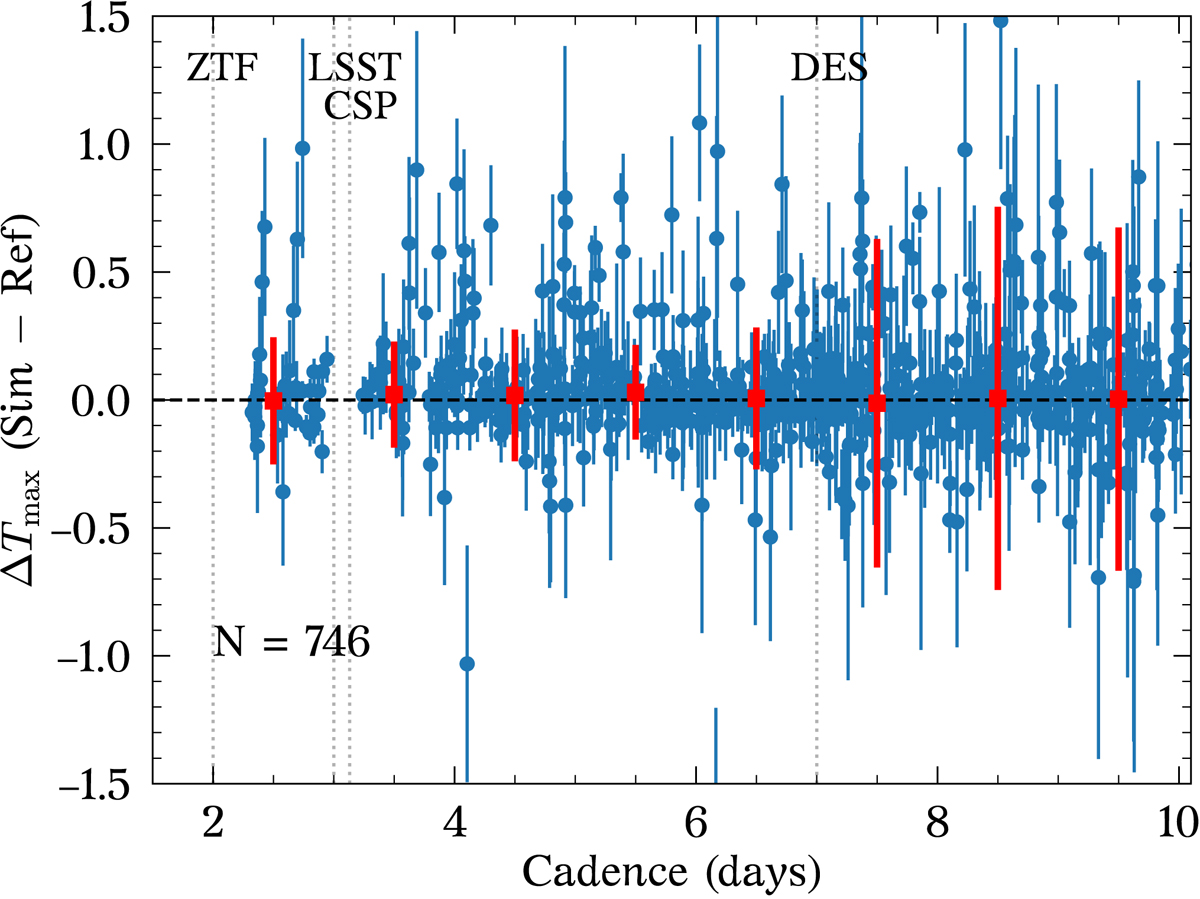
Fig. 9.
Download original image
Difference in Tmax between the cadence simulations (Sect. 5.1) and reference sample (ΔTmax) as a function of restframe cadence. The binned average and standard deviation of ΔTmax are shown as red squares with error bars. The average observed cadences for ZTF (2 days), LSST (assuming 3-day baseline cadence per filter), CSP (3.1 days for the reference sample), and DES (7 days; Brout et al. 2019) are shown as vertical dotted lines. We note that the restframe cadence is faster by a factor of 1 + z than the observed cadence; N is the total number of simulations.
Current usage metrics show cumulative count of Article Views (full-text article views including HTML views, PDF and ePub downloads, according to the available data) and Abstracts Views on Vision4Press platform.
Data correspond to usage on the plateform after 2015. The current usage metrics is available 48-96 hours after online publication and is updated daily on week days.
Initial download of the metrics may take a while.