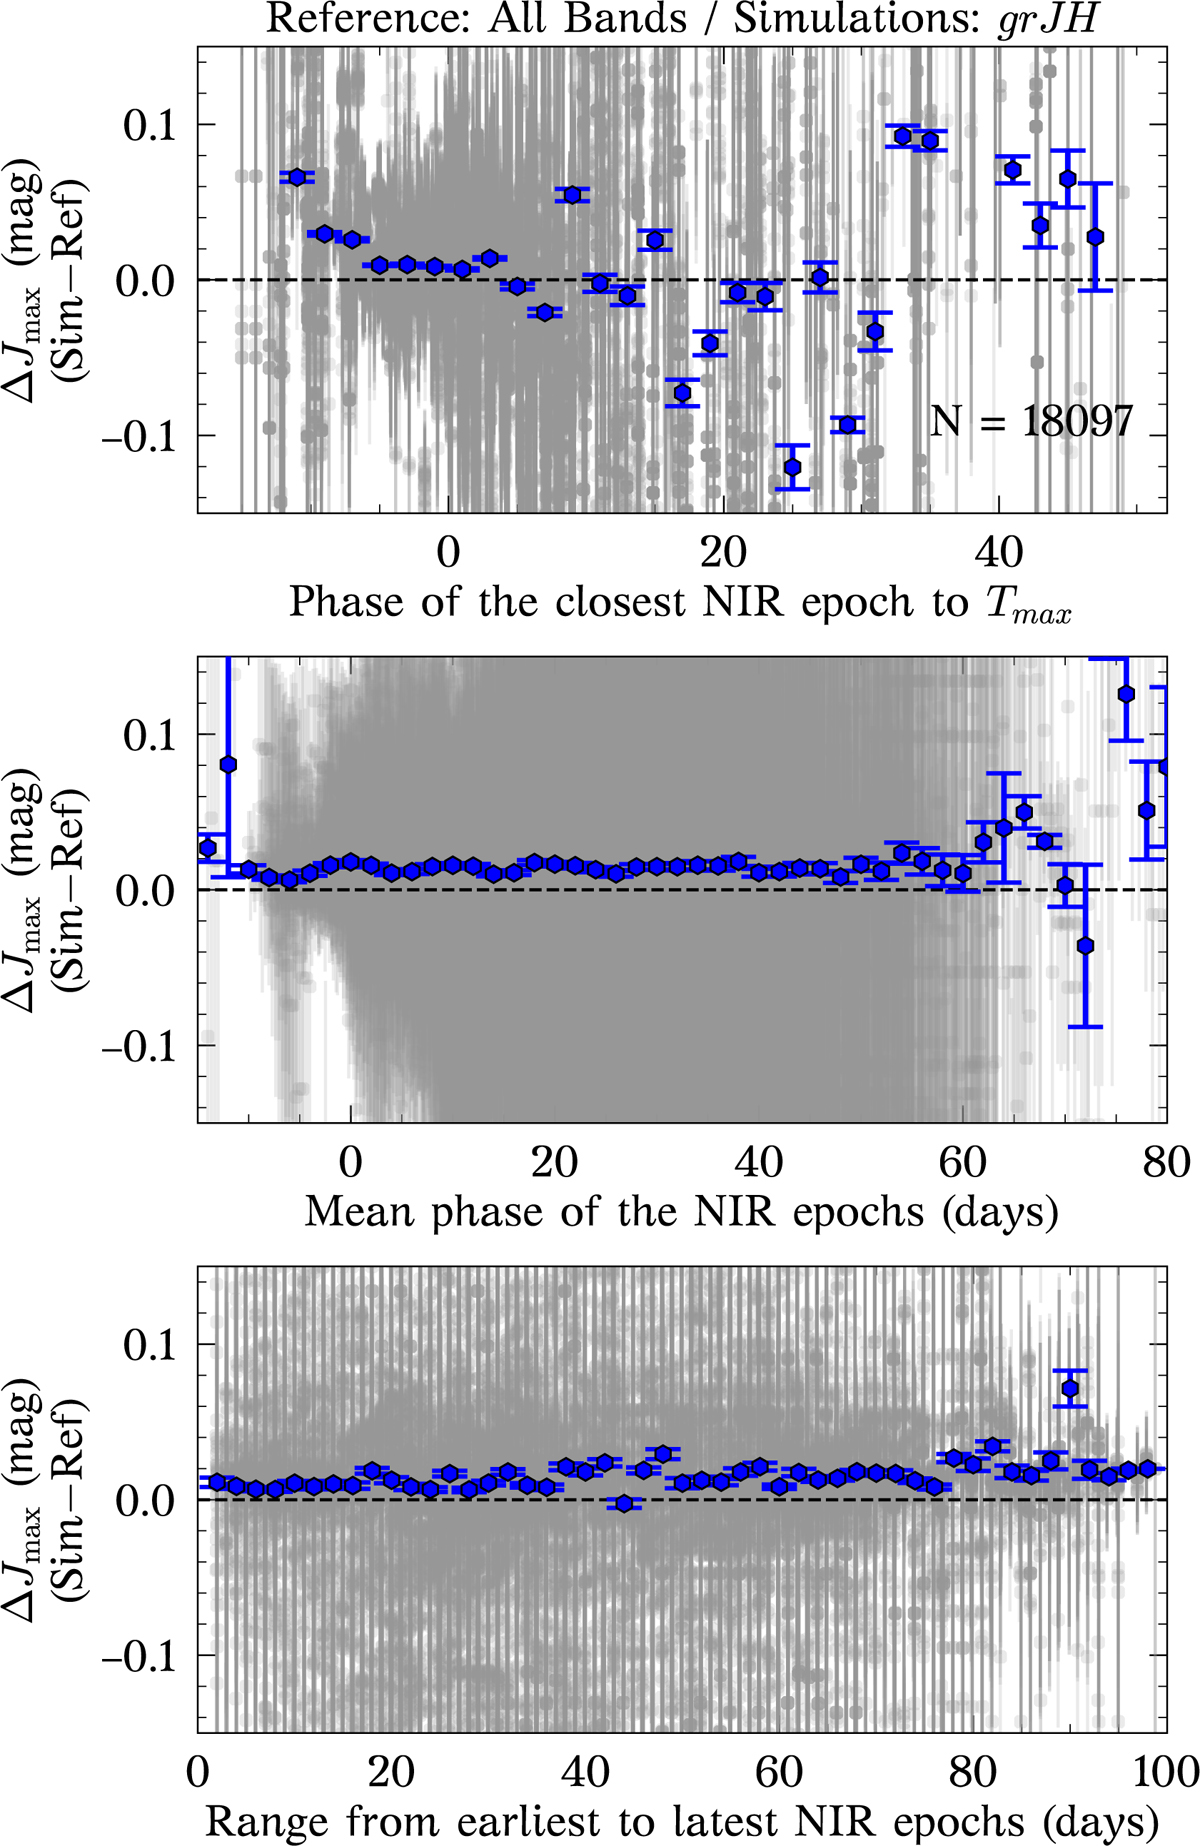
Fig. 7.
Download original image
Jmax residuals between simulations with three coeval J- and H-band epochs and reference sample as a function of metrics (i), (ii), and (iii) (top, middle, and bottom panels, respectively). The weighted mean and uncertainty on the weighted mean in bins of two days are shown in blue for each of the panels. The residuals in Jmax do not vary much as a function of metrics (ii) and (iii), which means that metric (i) is the most relevant for estimating Jmax. The metrics are described in Sect. 4, while N is the total number of simulations. The global offsets in the middle and bottom panels are driven by those simulations with phases ≲ − 5 days and ≳30 days from the top panel.
Current usage metrics show cumulative count of Article Views (full-text article views including HTML views, PDF and ePub downloads, according to the available data) and Abstracts Views on Vision4Press platform.
Data correspond to usage on the plateform after 2015. The current usage metrics is available 48-96 hours after online publication and is updated daily on week days.
Initial download of the metrics may take a while.