Fig. 6.
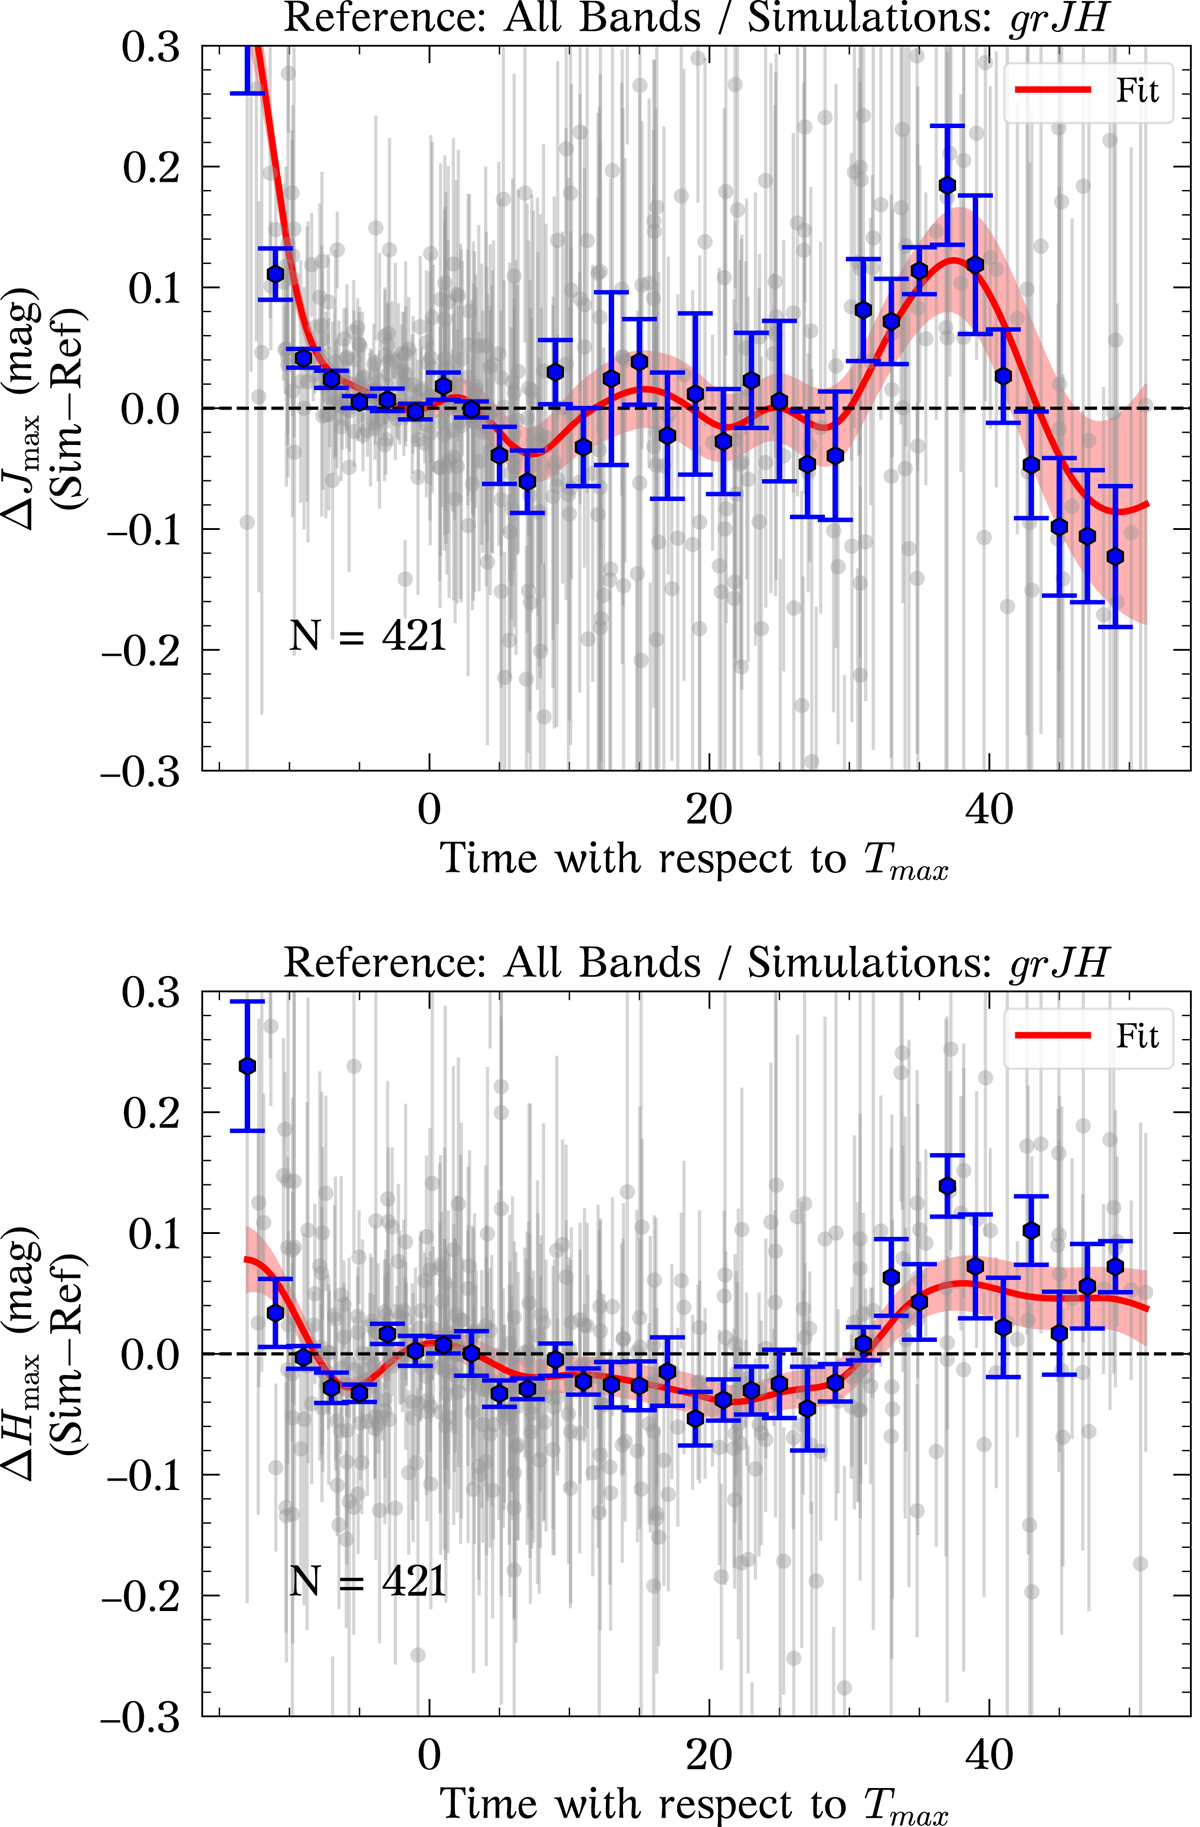
Download original image
Jmax (top panel) and Hmax (bottom panel) residuals, between simulations with coeval coeval J- and H-band epoch and reference value. The weighted mean and uncertainty on the weighted mean in bins of two days are shown in blue. A “correction snake” and its uncertainty are calculated by fitting the residuals with GPs (red line and shaded region), while N is the total number of simulations.
Current usage metrics show cumulative count of Article Views (full-text article views including HTML views, PDF and ePub downloads, according to the available data) and Abstracts Views on Vision4Press platform.
Data correspond to usage on the plateform after 2015. The current usage metrics is available 48-96 hours after online publication and is updated daily on week days.
Initial download of the metrics may take a while.