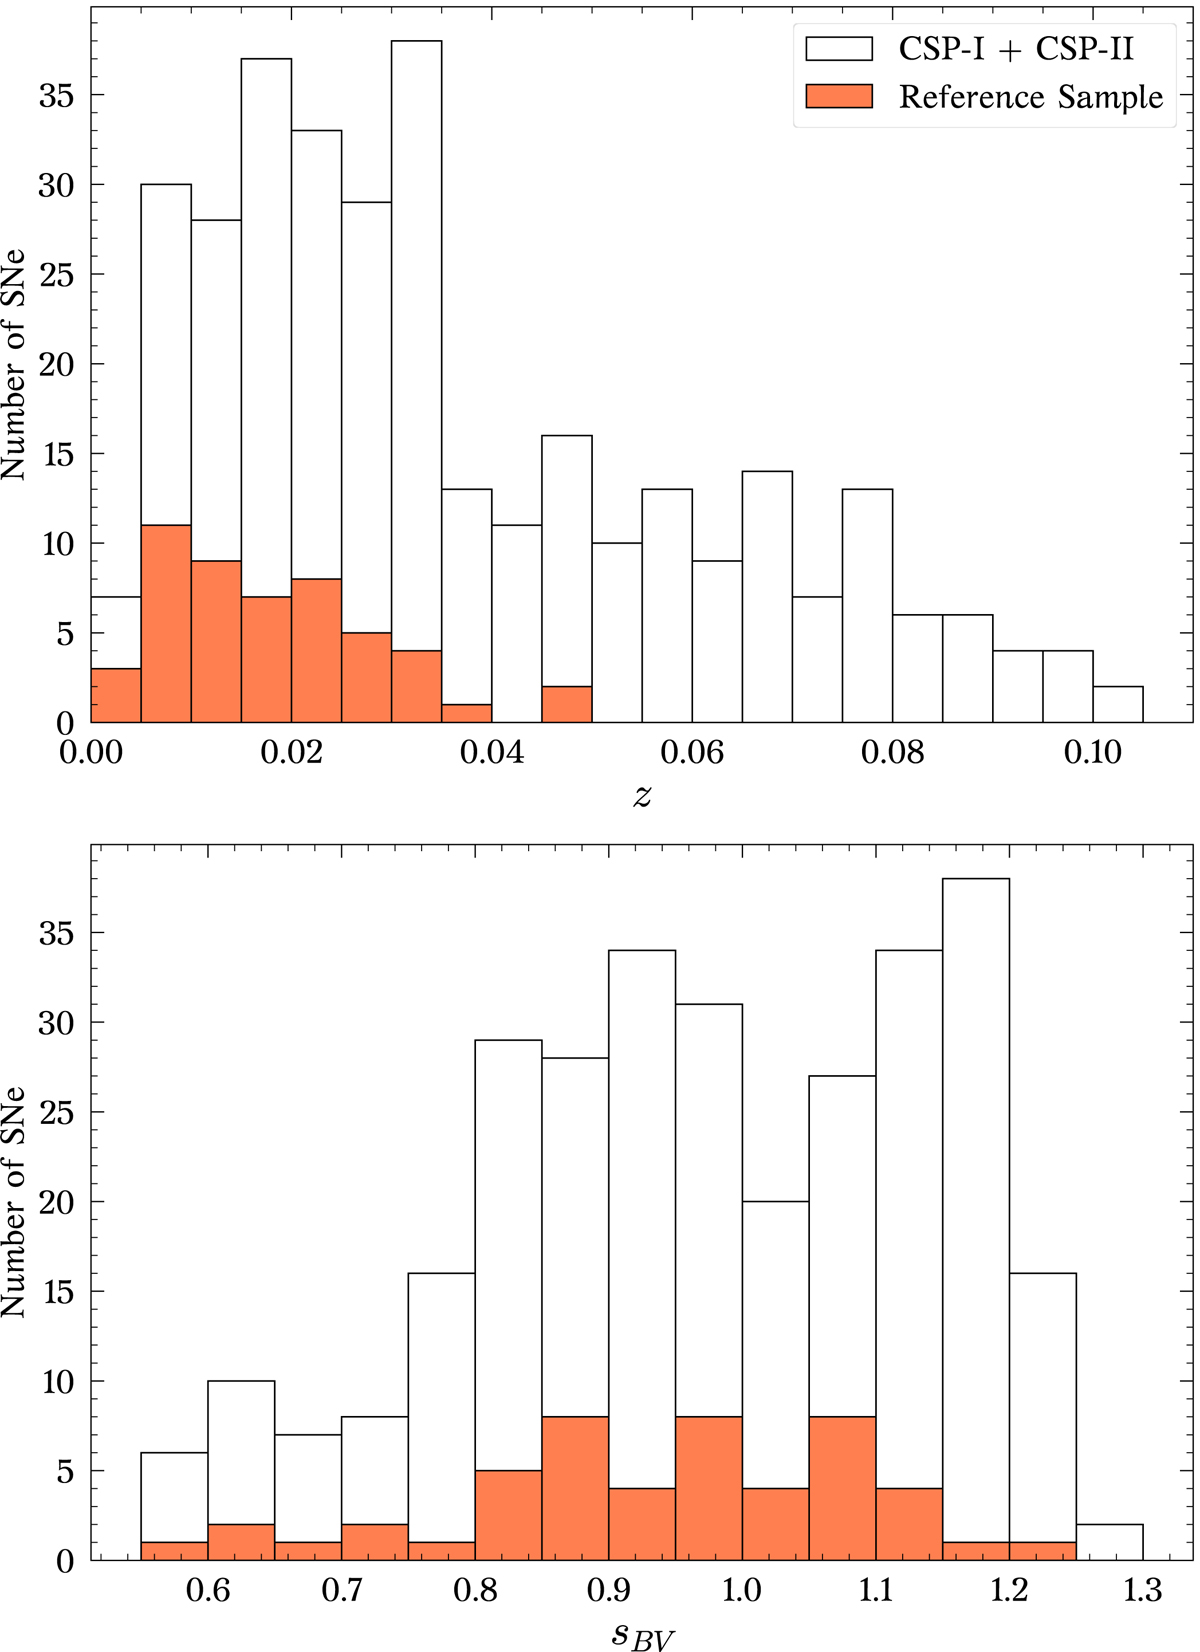
Fig. 2.
Download original image
Comparison between the reference and the entire CSP samples. Top panel: redshift distribution of CSP-I + CSP-II (empty bars) and the 50 SNe Ia comprising our reference sample (orange bars). Bottom panel: sBV distribution of SNe Ia from CSP-I + CSP-II (empty bars) labelled as ‘normal’ and the reference sample (orange bars). The values of sBV were obtained by fitting the SNe with SNooPy using the max_model model. Only the ‘normal’ SNe are shown in this case as SNooPy mainly provides templates for these objects and not other types.
Current usage metrics show cumulative count of Article Views (full-text article views including HTML views, PDF and ePub downloads, according to the available data) and Abstracts Views on Vision4Press platform.
Data correspond to usage on the plateform after 2015. The current usage metrics is available 48-96 hours after online publication and is updated daily on week days.
Initial download of the metrics may take a while.