Fig. 16.
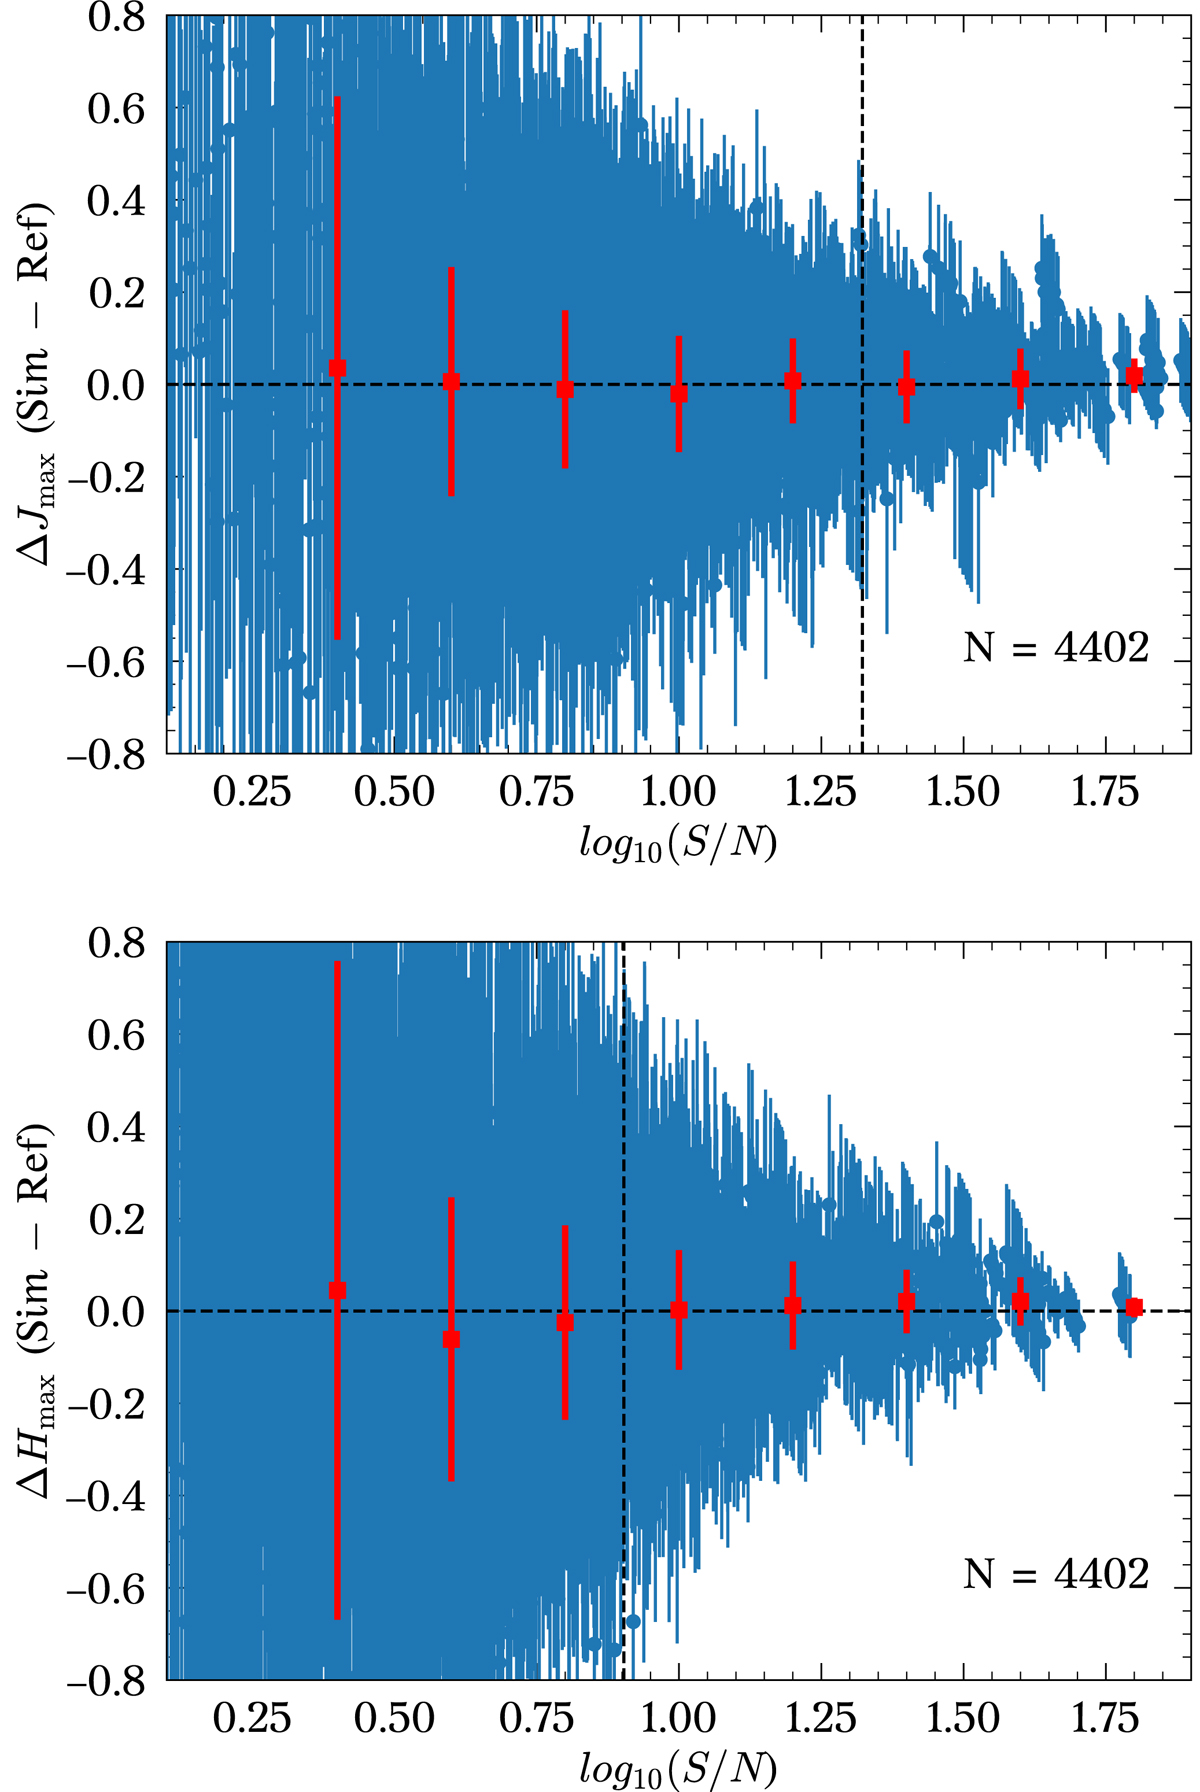
Download original image
Difference in Jmax (top panel) and Hmax (bottom panel) between the NIR S/N simulations (Sect. 5.3) and reference sample as a function of S/N. The binned median and standard deviations are shown as red squares with error bars. Simulations with all S/N values are shown in here. The average S/N of CSP SNe Ia at z > 0.08 are shown as vertical lines (21 and 8 for J and H bands, respectively); N is the total number of simulations.
Current usage metrics show cumulative count of Article Views (full-text article views including HTML views, PDF and ePub downloads, according to the available data) and Abstracts Views on Vision4Press platform.
Data correspond to usage on the plateform after 2015. The current usage metrics is available 48-96 hours after online publication and is updated daily on week days.
Initial download of the metrics may take a while.