Fig. 14.
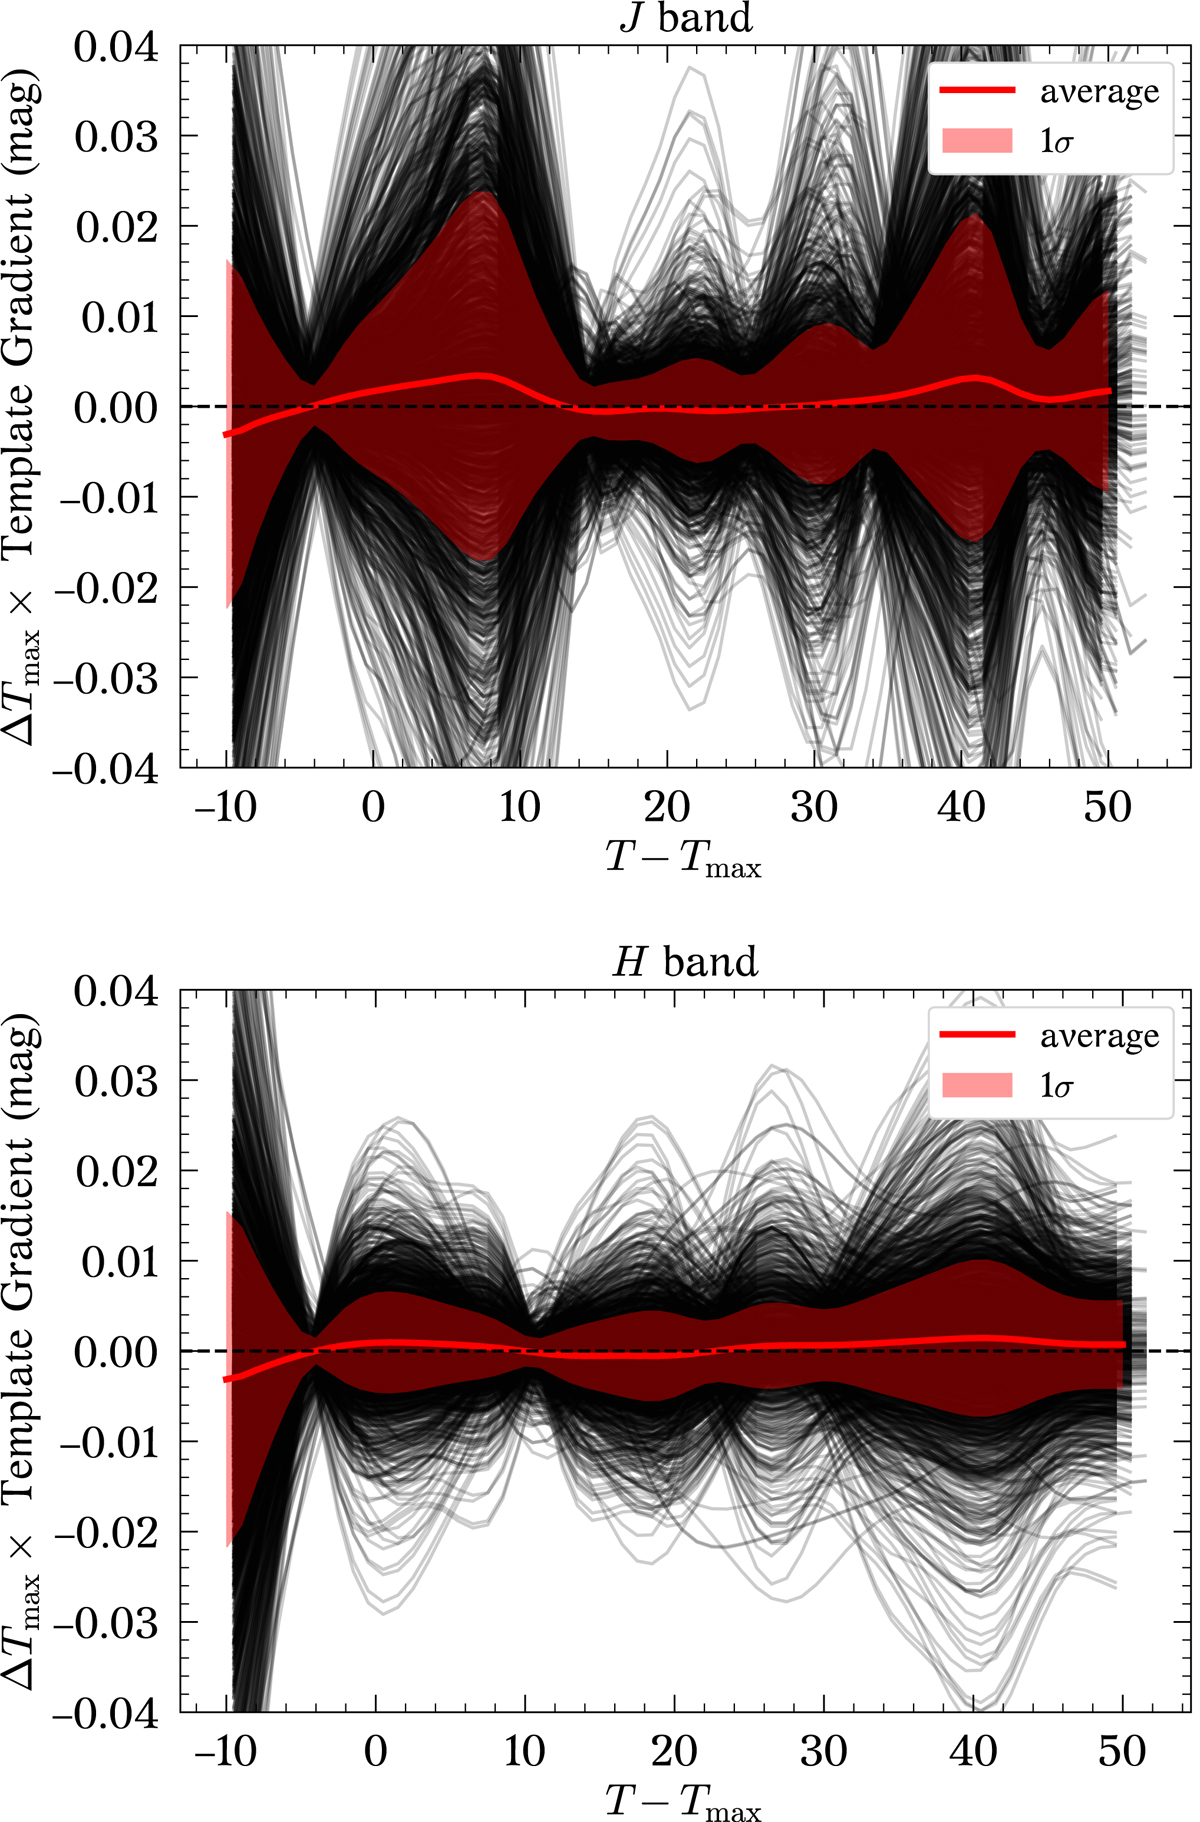
Download original image
Effect that S/N in the optical gr-bands has on the estimation of the NIR peak magnitudes. The grey lines represent ΔTmax multiplied by the gradient of the NIR light-curve template bands as a function of phase, for each simulated SN from Sect. 5.2. We note that the shape of the templates depends on the value of sBV, which is obtained from the fits of the gr-band light curves. The average NIR peak magnitude offset is shown as a red line for J (top panel) and H (bottom panel) bands. The 1σ scatter in NIR peak magnitude (red shaded region) is ≲0.02 mag for J band and < 0.01 mag for H band.
Current usage metrics show cumulative count of Article Views (full-text article views including HTML views, PDF and ePub downloads, according to the available data) and Abstracts Views on Vision4Press platform.
Data correspond to usage on the plateform after 2015. The current usage metrics is available 48-96 hours after online publication and is updated daily on week days.
Initial download of the metrics may take a while.