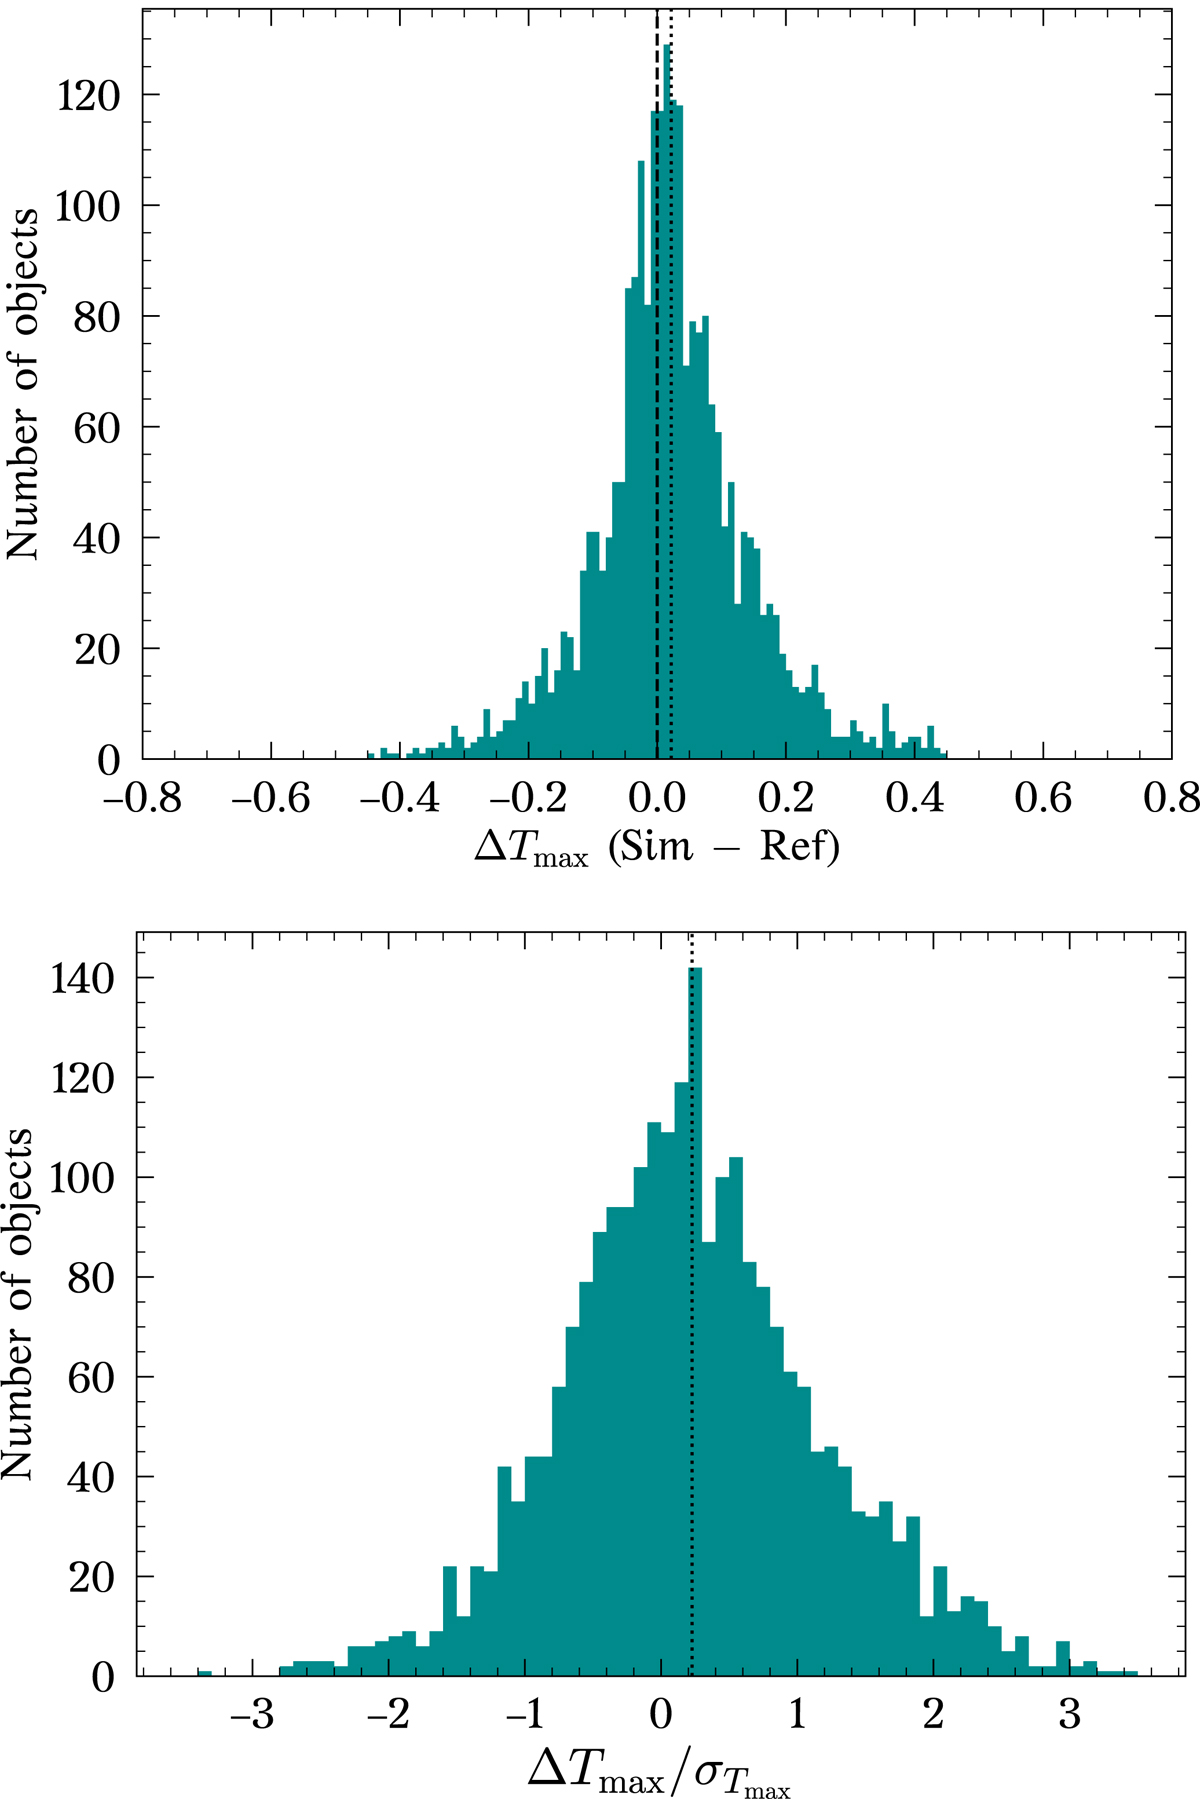
Fig. 12.
Download original image
Tmax comparison for S/N simulations. Top panel: difference in Tmax between the S/N simulations (Sect. 5.2) and reference sample (ΔTmax). The weighted average ΔTmax is −0.007 days (vertical dotted line). Bottom panel: ΔTmax over the uncertainty in Tmax (i.e. significance) for the S/N simulations. The average significance is 0.23 (vertical dotted line), while very few simulations have a significance greater than 3.0. The average uncertainty in Tmax (0.12 days) is larger than the weighted average ΔTmax.
Current usage metrics show cumulative count of Article Views (full-text article views including HTML views, PDF and ePub downloads, according to the available data) and Abstracts Views on Vision4Press platform.
Data correspond to usage on the plateform after 2015. The current usage metrics is available 48-96 hours after online publication and is updated daily on week days.
Initial download of the metrics may take a while.