Fig. 11.
Download original image
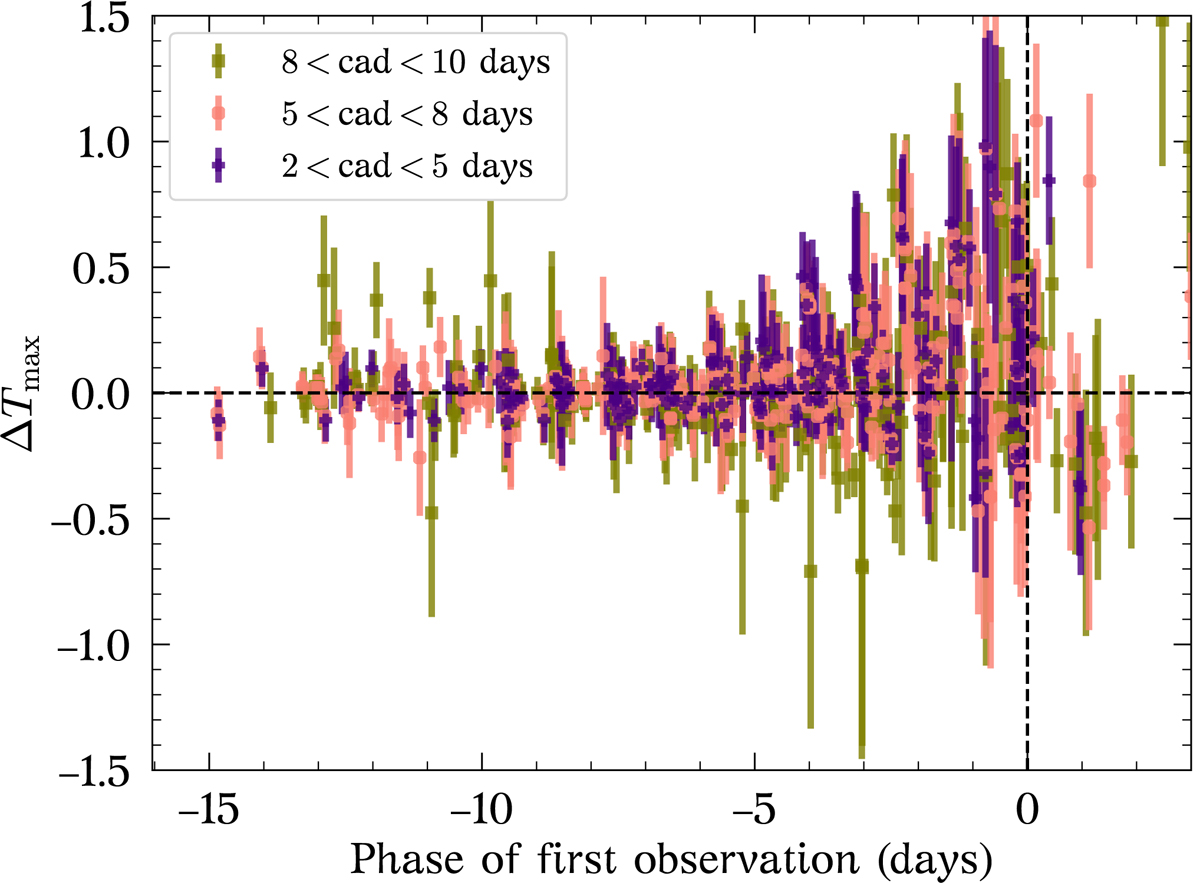
Difference in Tmax between the cadence simulations (Sect. 5.1) and reference sample (ΔTmax) as a function of the phase of the first observation. The simulations are split in three groups according to the cadence (cad) range: 2 < cad < 5 days (purple crosses), 5 < cad < 8 days (pink circles), and 8 < cad < 10 days (gold squares). Tmax is shown as a vertical dashed line. Independent of the cadence, the scatter in ΔTmax starts rapidly increasing for the first observations with phases of ≳ − 5 days.
Current usage metrics show cumulative count of Article Views (full-text article views including HTML views, PDF and ePub downloads, according to the available data) and Abstracts Views on Vision4Press platform.
Data correspond to usage on the plateform after 2015. The current usage metrics is available 48-96 hours after online publication and is updated daily on week days.
Initial download of the metrics may take a while.