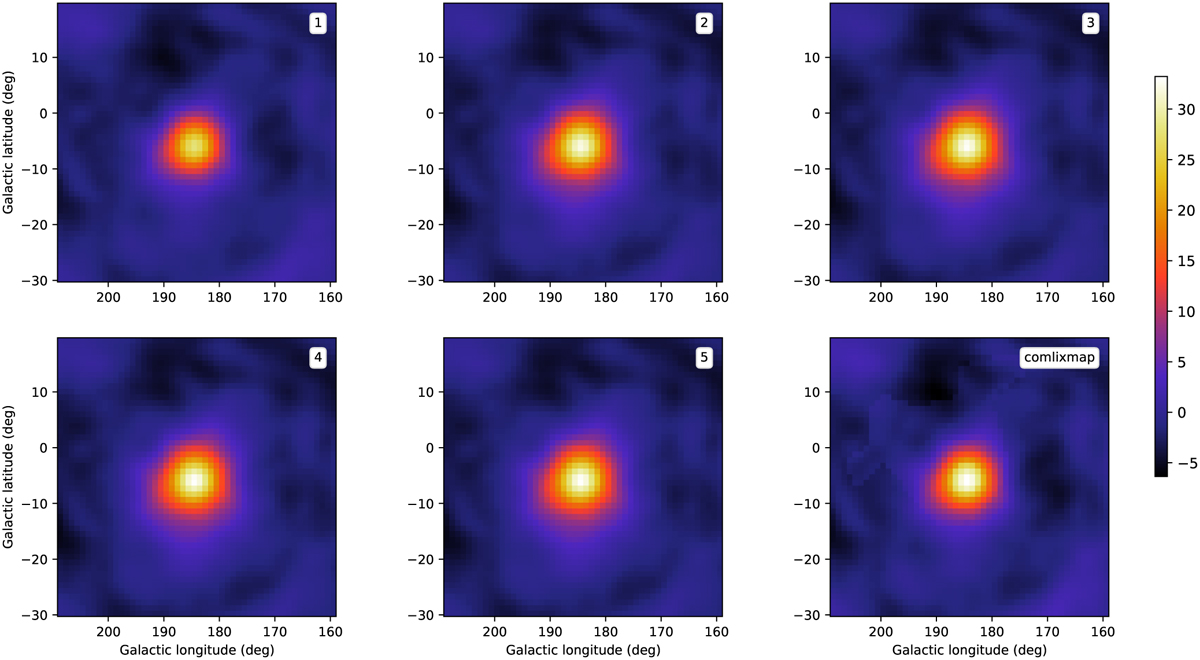
Fig. 7
Download original image
Test statistic maps of viewing period 1.0 (during which the Crab pulsar and pulsar wind nebula was observed) for the combined analysis of the four standard COMPTEL energy bands as a function of the number of SRCLIX iterations, indicated in the upper-right corner of each panel. The BGDLIXE algorithm with Navgr = 5, Nincl = 15, and Nexcl = 0 was employed. The lower-right panel shows the TS map obtained using the comlixmap script. Colour maps are shown in units of ![]() . Negative values correspond to negative fluxes of the test source.
. Negative values correspond to negative fluxes of the test source.
Current usage metrics show cumulative count of Article Views (full-text article views including HTML views, PDF and ePub downloads, according to the available data) and Abstracts Views on Vision4Press platform.
Data correspond to usage on the plateform after 2015. The current usage metrics is available 48-96 hours after online publication and is updated daily on week days.
Initial download of the metrics may take a while.