Fig. 6
Download original image
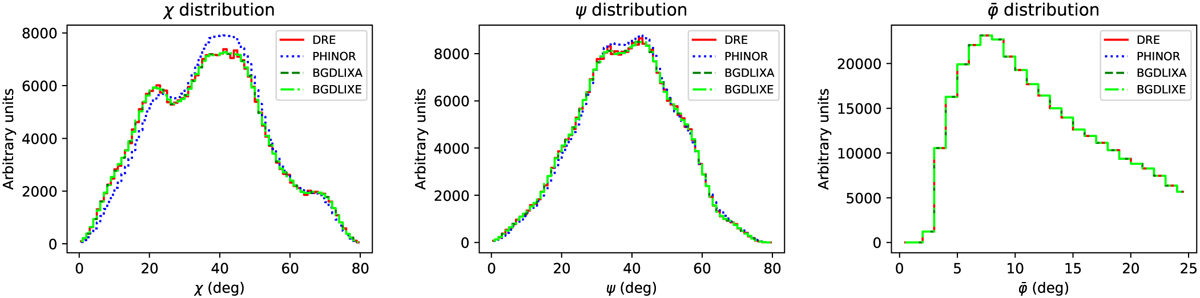
Comparison of PHINOR (blue dotted), BGDLIXA (dark green dashed), and BGDLIXE (light green dashed-dotted) background model for viewing period 1.0 and the energy band 1–3 MeV to the DRE event distribution (red solid). The left panel shows the distribution of χ values, obtained by summing overall ψ and ![]() , the middle panel shows the distribution of ψ values, obtained by summing over all χ and
, the middle panel shows the distribution of ψ values, obtained by summing over all χ and ![]() , and the right panel shows the distribution of
, and the right panel shows the distribution of ![]() values, obtained by summing overall χ and ψ.
values, obtained by summing overall χ and ψ.
Current usage metrics show cumulative count of Article Views (full-text article views including HTML views, PDF and ePub downloads, according to the available data) and Abstracts Views on Vision4Press platform.
Data correspond to usage on the plateform after 2015. The current usage metrics is available 48-96 hours after online publication and is updated daily on week days.
Initial download of the metrics may take a while.