Fig. 3
Download original image
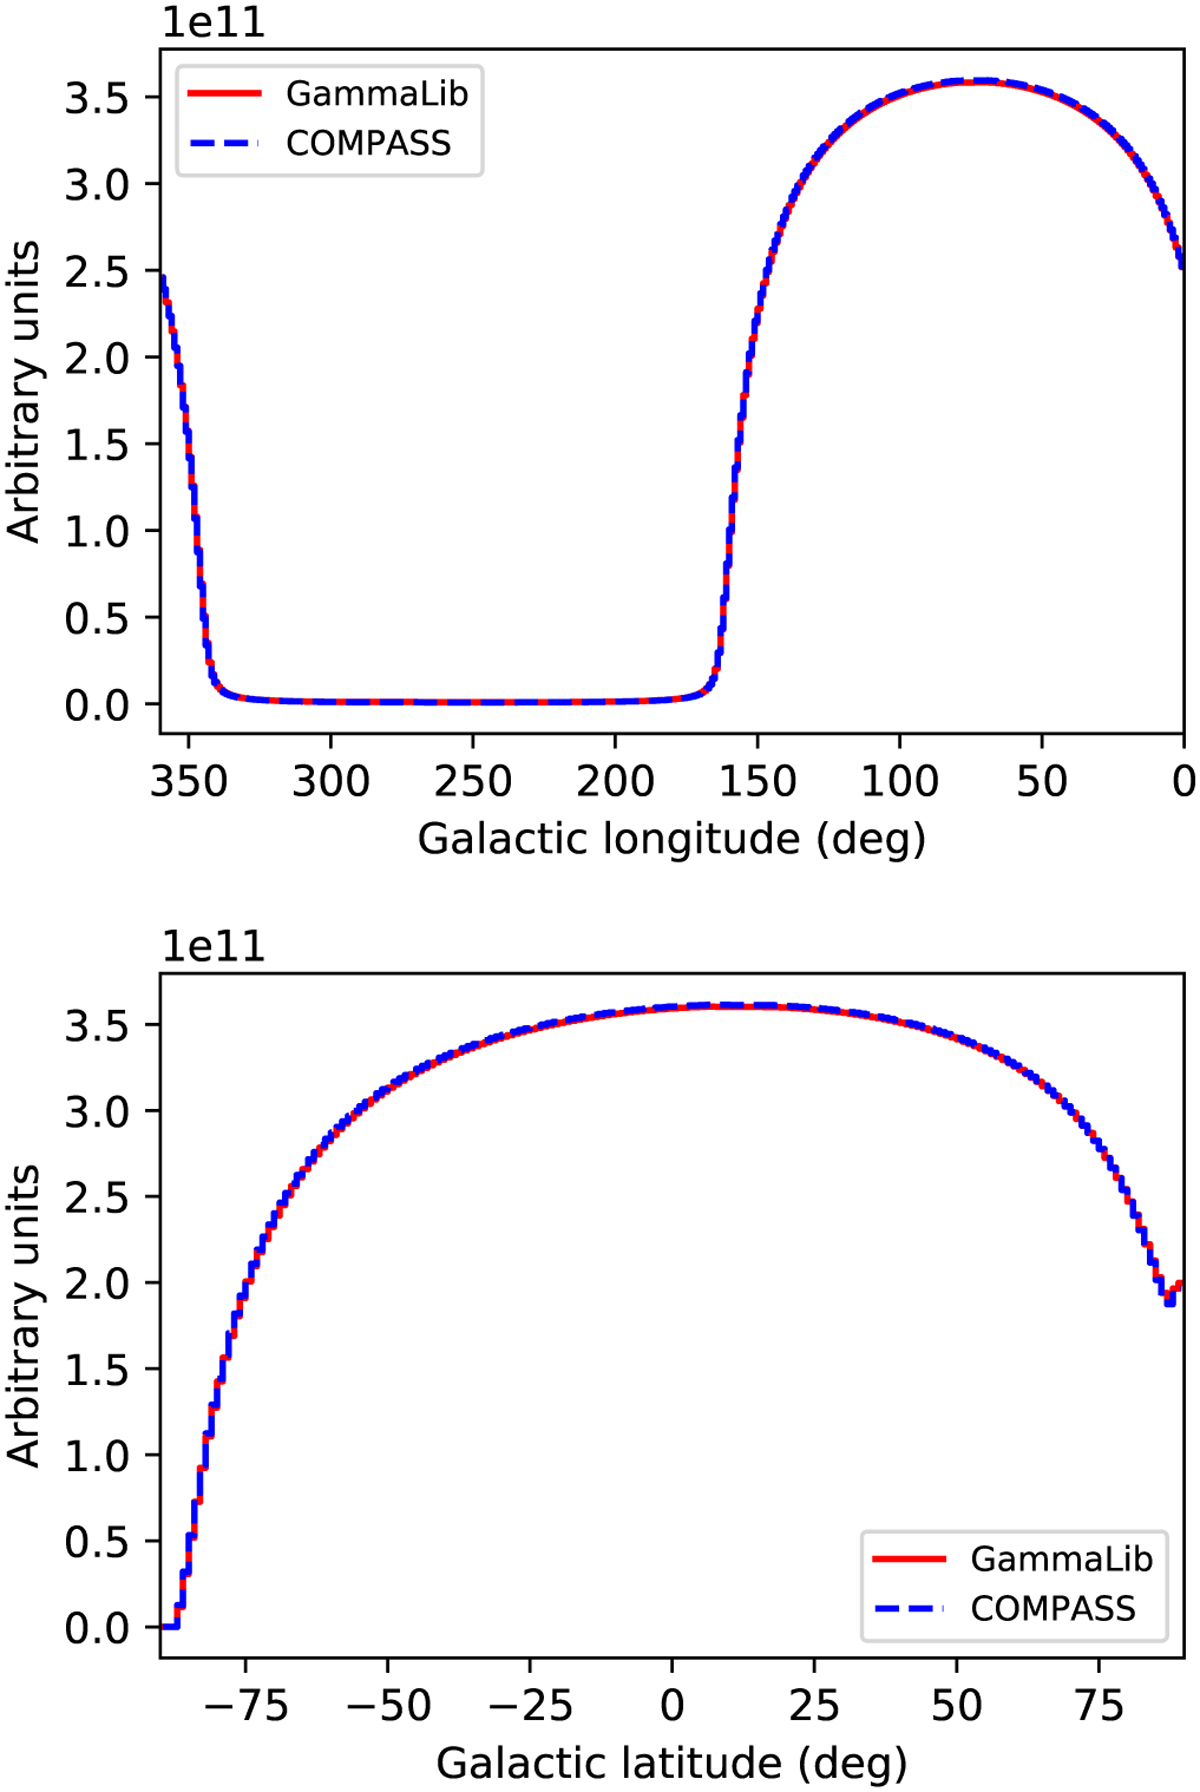
Comparison of an exposure map obtained with GammaLib for viewing period 2.0 (red solid) to the exposure map MPE-DRX-32382 obtained with COMPASS (blue dashed). The upper panel shows the distribution of Galactic longitude values, obtained by summing over all Galactic latitudes, and the lower panel shows the distribution of Galactic latitude values, obtained by summing over all Galactic longitudes.
Current usage metrics show cumulative count of Article Views (full-text article views including HTML views, PDF and ePub downloads, according to the available data) and Abstracts Views on Vision4Press platform.
Data correspond to usage on the plateform after 2015. The current usage metrics is available 48-96 hours after online publication and is updated daily on week days.
Initial download of the metrics may take a while.