Fig. 19
Download original image
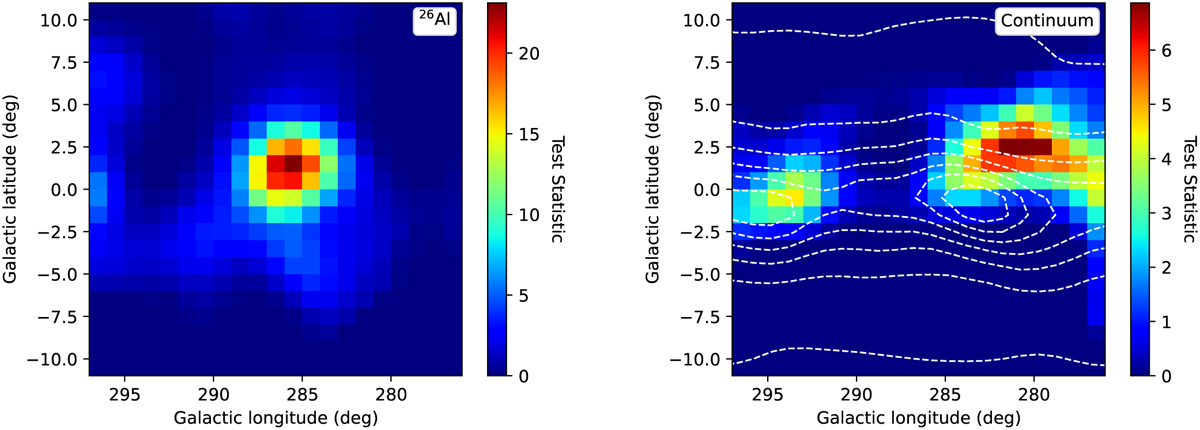
Test statistic maps of 1.8 MeV line emission (left) and 1–3 MeV continuum emission (right) obtained using comlixmap for the Carina region. The map on the left is equivalent to Fig. 2 of Knödlseder et al. (1996a). Dashed contours in the map on the right reflect the intensity of a combination of Galactic bremsstrahlung and inverse Compton emission maps as fitted in an independent analysis where a model of a 1.8 MeV line point source was fitted together with a combination of bremsstrahlung and inverse Compton spatial maps to the data (see text).
Current usage metrics show cumulative count of Article Views (full-text article views including HTML views, PDF and ePub downloads, according to the available data) and Abstracts Views on Vision4Press platform.
Data correspond to usage on the plateform after 2015. The current usage metrics is available 48-96 hours after online publication and is updated daily on week days.
Initial download of the metrics may take a while.