Fig. 18
Download original image
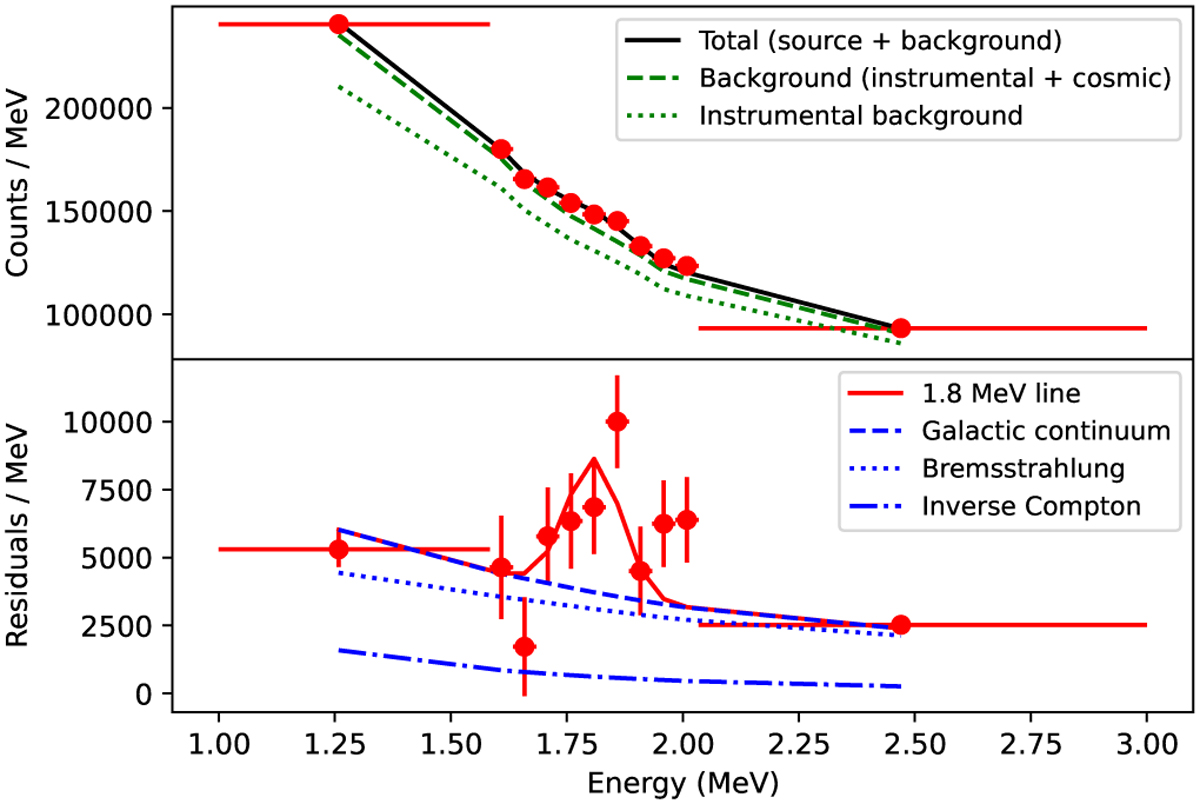
Count spectrum of the Carina region determined for 11 bins covering the energy band 1–3 MeV. The top panel shows the measured number of counts per MeV together with the best fitting background model (green dashed), composed of instrumental background (green dotted) and cosmic gamma-ray background. The combined source and background model is shown as a black solid line. The bottom panel shows the background model-subtracted count spectrum together with the best fitting 1.8 MeV line model (red solid) on top of the combined Galactic continuum components (blue dashed), composed of bremsstrahlung (blue dotted) and inverse Compton emission (blue dash-dotted).
Current usage metrics show cumulative count of Article Views (full-text article views including HTML views, PDF and ePub downloads, according to the available data) and Abstracts Views on Vision4Press platform.
Data correspond to usage on the plateform after 2015. The current usage metrics is available 48-96 hours after online publication and is updated daily on week days.
Initial download of the metrics may take a while.