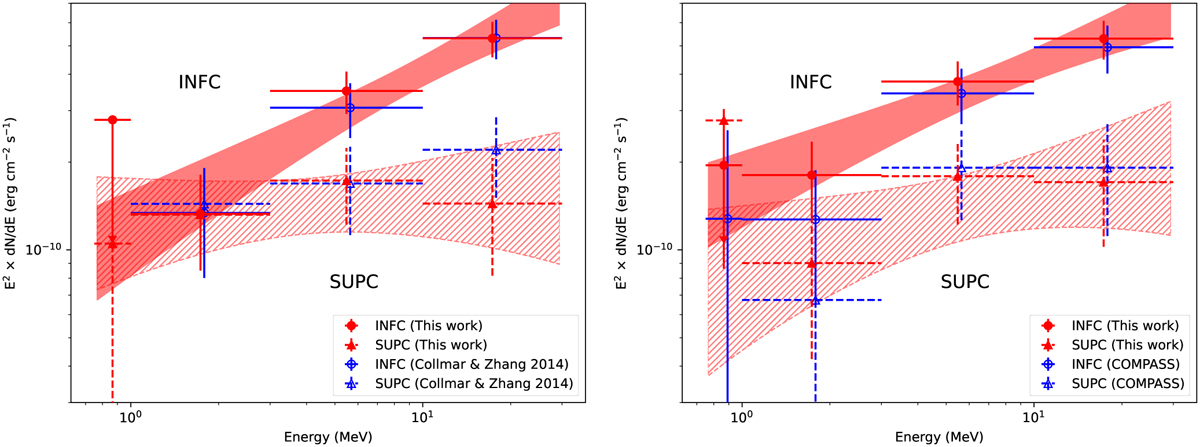
Fig. 16
Download original image
Spectral energy distributions and 1er uncertainty bands of fitted power-law models for LS 5039 for the INFC (solid lines and filled area) and the SUPC (dashed lines and hatched area). The left panel compares the ctools and GammaLib results (red) to the results obtained by Collmar & Zhang (2014) for an identical event selection (blue). The right panel compares the ctools and GammaLib results (red) to the results obtained using the COMPASS software by excluding D2 modules with faulty PMTs (blue). Data points from Collmar & Zhang (2014) and derived using COMPASS were displaced by 3% in energy for clarity.
Current usage metrics show cumulative count of Article Views (full-text article views including HTML views, PDF and ePub downloads, according to the available data) and Abstracts Views on Vision4Press platform.
Data correspond to usage on the plateform after 2015. The current usage metrics is available 48-96 hours after online publication and is updated daily on week days.
Initial download of the metrics may take a while.