Fig. 15
Download original image
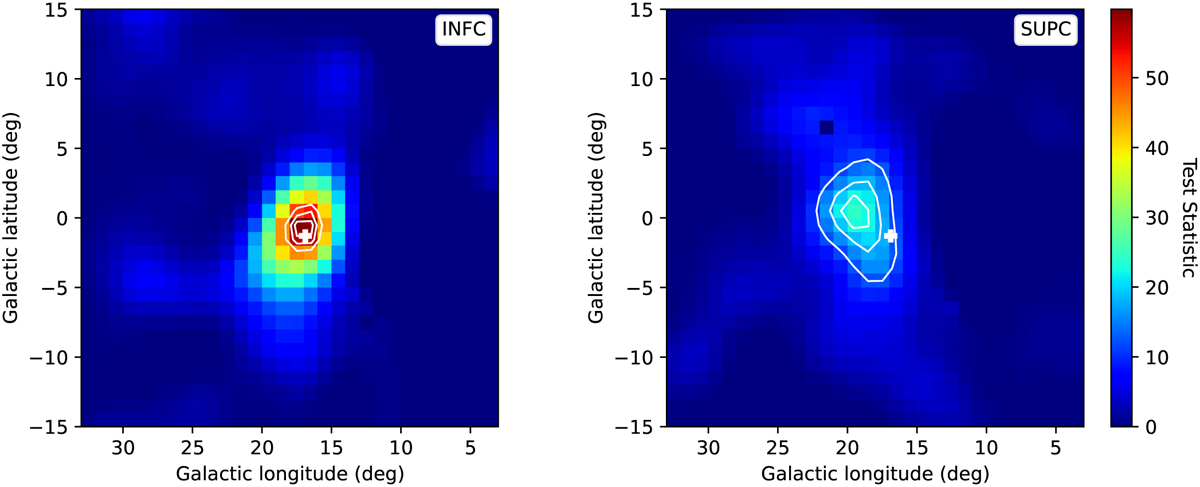
Test statistic maps of LS 5039 for inferior conjunction (left) and superior conjunction (right) phase intervals derived by jointly fitting the four standard COMPTEL energy bands, covering 0.75–30 MeV. The location of LS 5039 is shown by a white plus symbol, and contours show the 1σ, 2σ% and 3σ location uncertainties. The quasar PKS 1830-210 was included in the source model and hence is not visible in the maps.
Current usage metrics show cumulative count of Article Views (full-text article views including HTML views, PDF and ePub downloads, according to the available data) and Abstracts Views on Vision4Press platform.
Data correspond to usage on the plateform after 2015. The current usage metrics is available 48-96 hours after online publication and is updated daily on week days.
Initial download of the metrics may take a while.