Fig. 14
Download original image
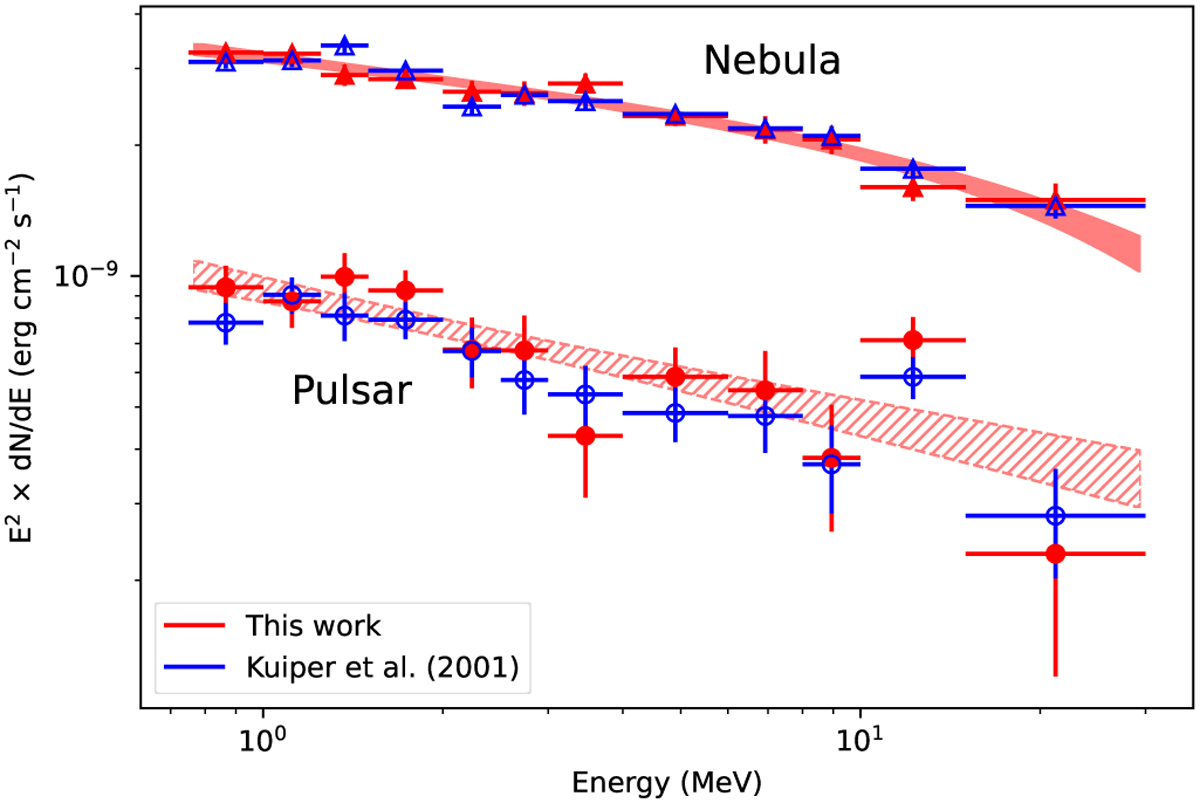
Spectral energy distributions of the Crab pulsar and pulsar wind nebula components as determined using GammaLib and ctools (red) and by Kuiper et al. (2001) using COMPASS (blue). Results for the Crab pulsar are shown as dots, and results for the Crab pulsar wind nebula are shown as triangles. The figure also shows the 1σ uncertainty bands of the best fitting spectral models for both components.
Current usage metrics show cumulative count of Article Views (full-text article views including HTML views, PDF and ePub downloads, according to the available data) and Abstracts Views on Vision4Press platform.
Data correspond to usage on the plateform after 2015. The current usage metrics is available 48-96 hours after online publication and is updated daily on week days.
Initial download of the metrics may take a while.