Fig. 12
Download original image
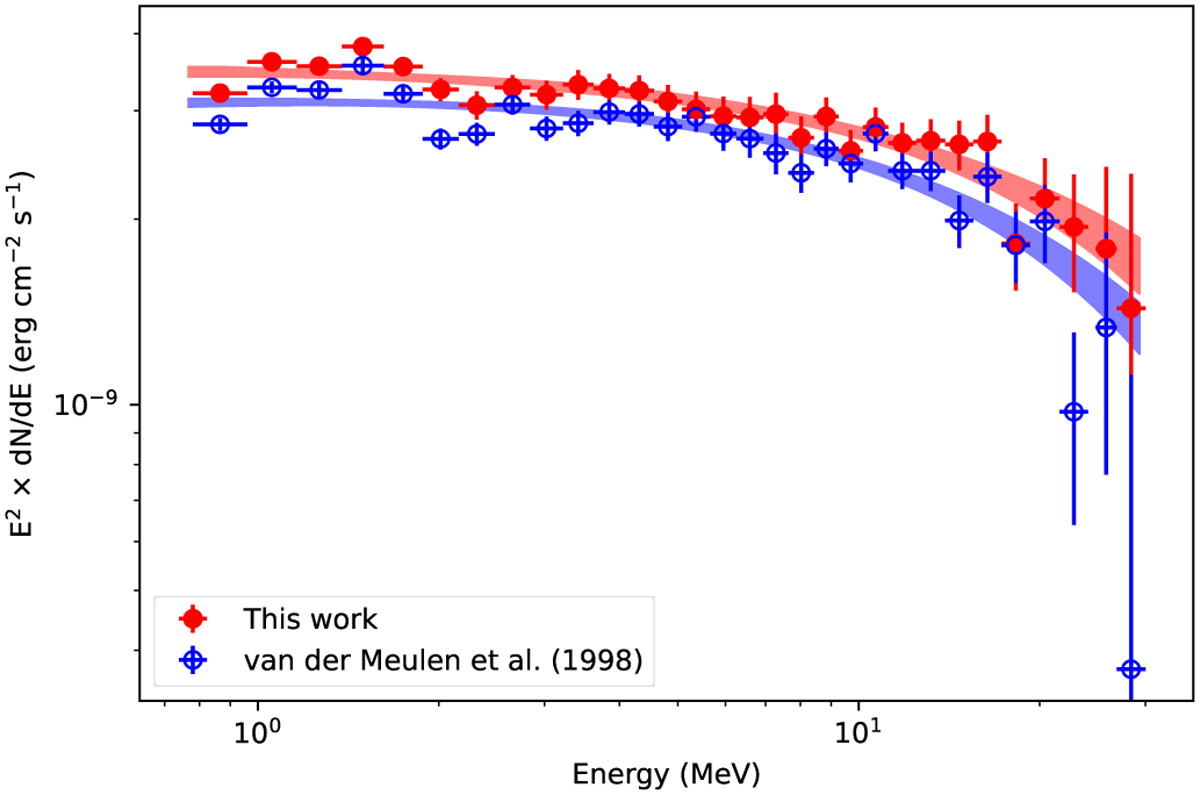
Spectral energy distribution of the total emission from the Crab pulsar and pulsar wind nebula as measured by COMPTEL in 30 bins covering the energy band 0.78–30 MeV. Filled red dots correspond to results obtained with ctools, and open blue dots correspond to results obtained by van der Meulen et al. (1998) using COMPASS. The shaded regions correspond to the 1σ uncertainty bands of the fitted exponentially cut-off power-law models.
Current usage metrics show cumulative count of Article Views (full-text article views including HTML views, PDF and ePub downloads, according to the available data) and Abstracts Views on Vision4Press platform.
Data correspond to usage on the plateform after 2015. The current usage metrics is available 48-96 hours after online publication and is updated daily on week days.
Initial download of the metrics may take a while.