Fig. 11
Download original image
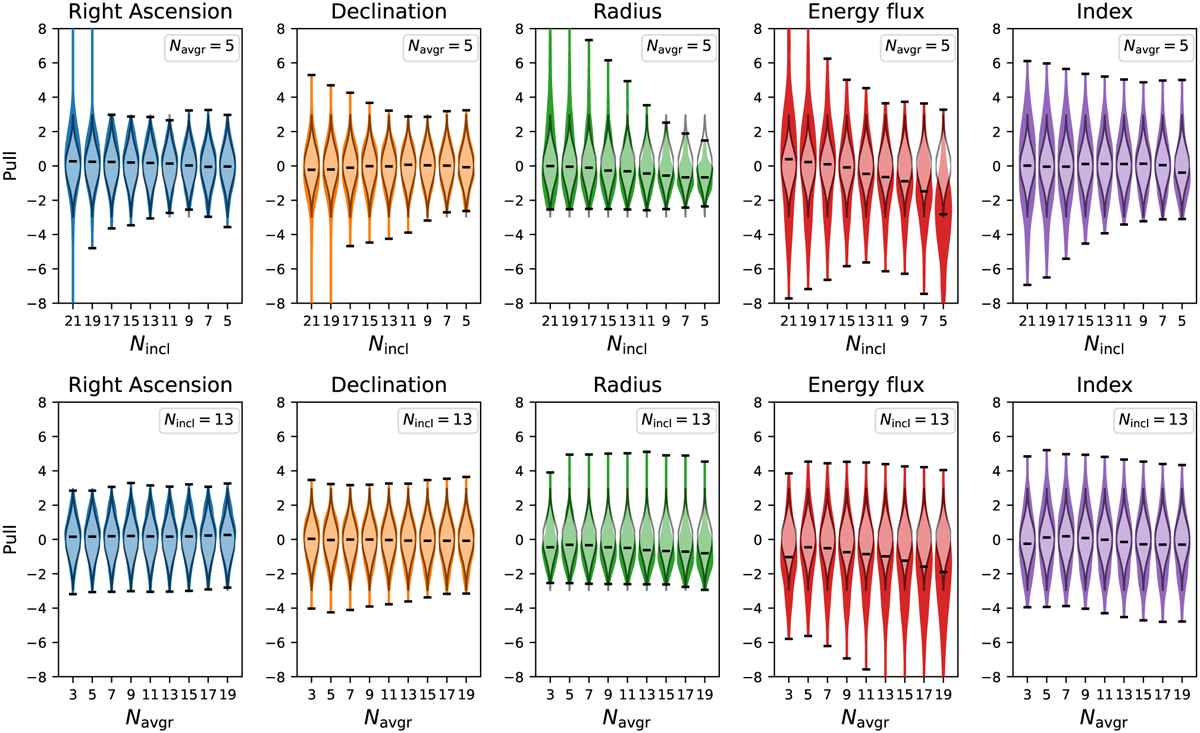
Violin plots of the fitted parameter pull distributions for a simulated source at a 20° off-axis angle for all viewing periods except those that include the Crab. The upper row shows results as a function of Nincl for Navgr = 5; the lower row shows results as a function of Navgr for Nincl = 13. For all simulations the source was simulated as a spatially extended disk with a 3° radius and with a power-law spectrum of index Γ = 2.1. Horizontal black bars show the maximum, the median, and the minimum values, respectively. Semi-transparent violins with grey borders indicate the expected pull distributions from statistical fluctuations only.
Current usage metrics show cumulative count of Article Views (full-text article views including HTML views, PDF and ePub downloads, according to the available data) and Abstracts Views on Vision4Press platform.
Data correspond to usage on the plateform after 2015. The current usage metrics is available 48-96 hours after online publication and is updated daily on week days.
Initial download of the metrics may take a while.