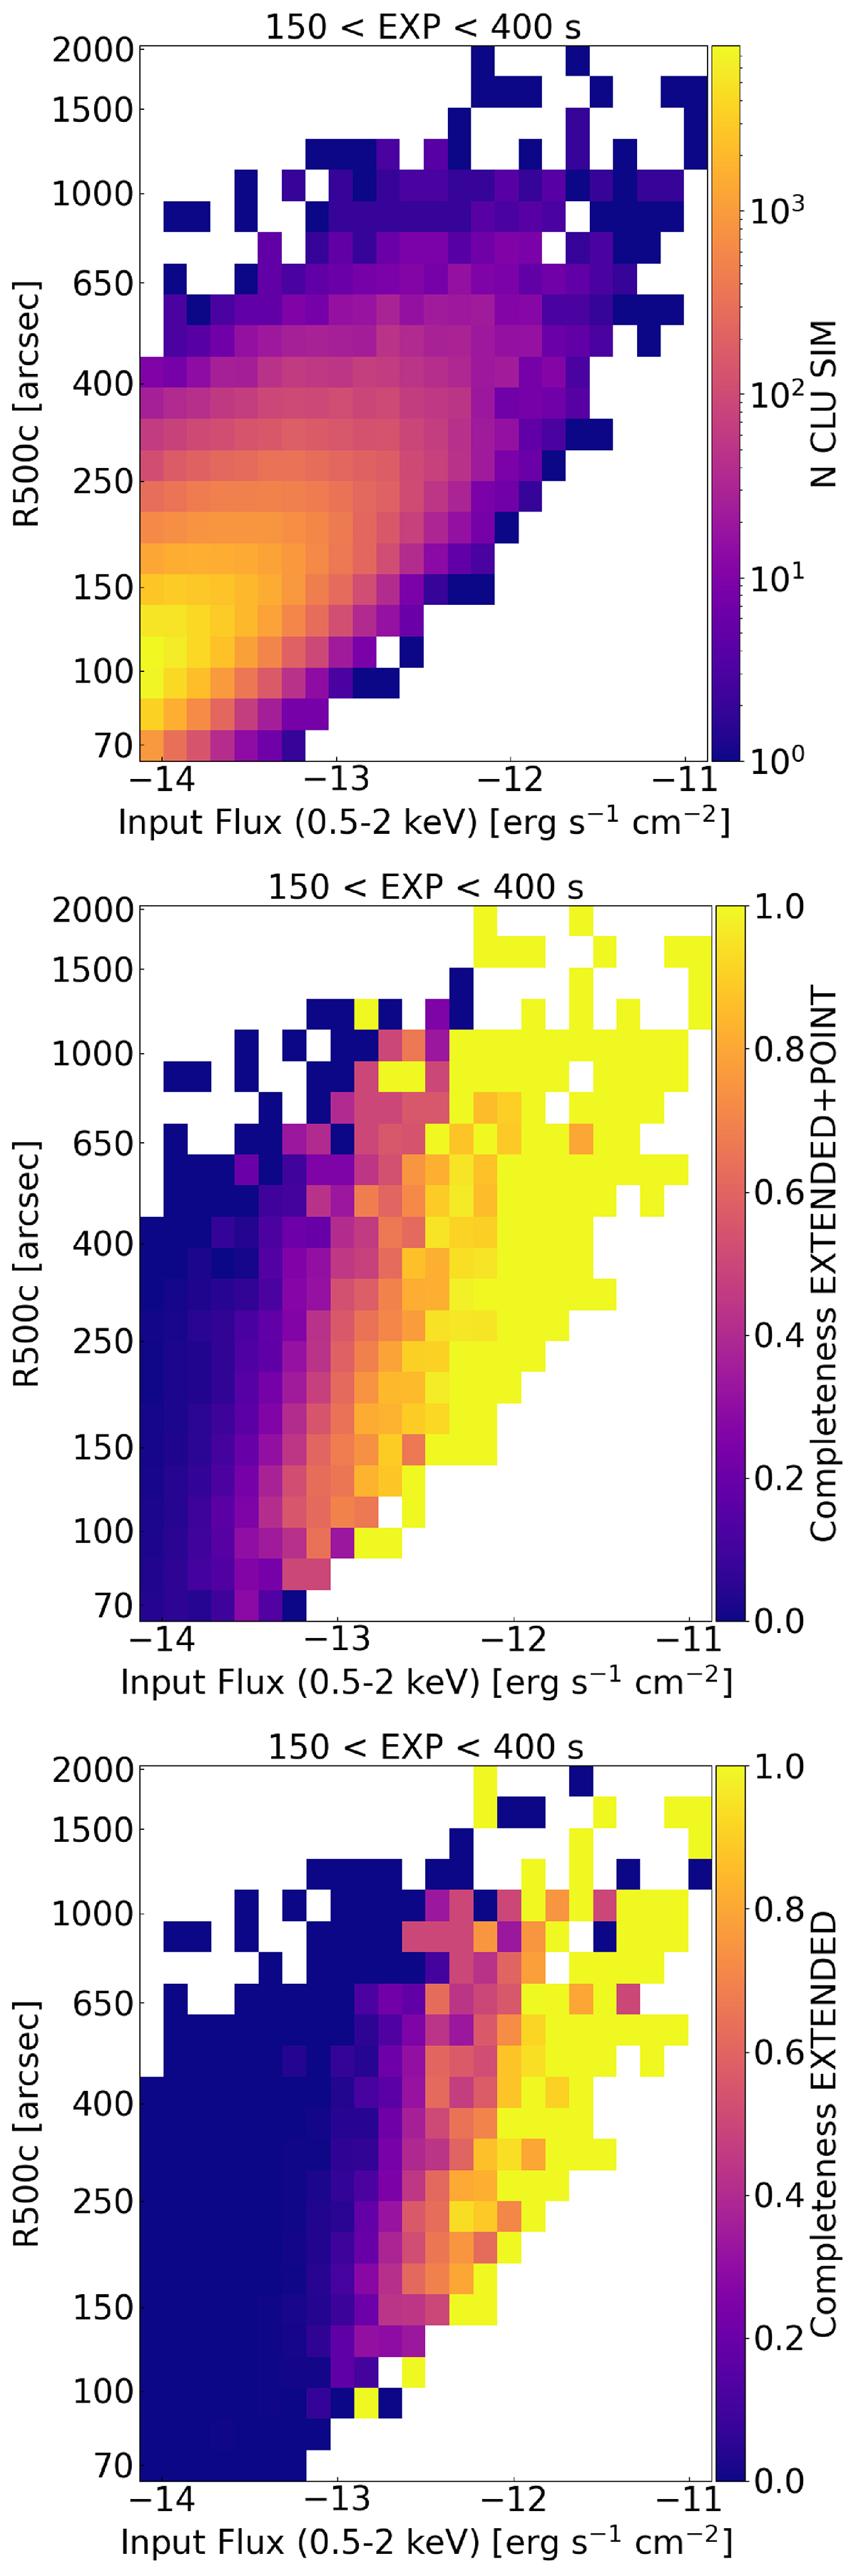
Fig. 8.
Download original image
Simulated and detected clusters population as a function of the input flux and size on the sky. The figures refer to areas of the eRASS1 simulation covered by an exposure between 150 s and 400 s. The blank spaces contain no input clusters. Top panel: number of simulated clusters in the flux–R500c space. Central panel: fraction of simulated clusters that is detected by eSASS, either as extended or point source. Bottom panel: fraction of simulated clusters that is only detected as extended.
Current usage metrics show cumulative count of Article Views (full-text article views including HTML views, PDF and ePub downloads, according to the available data) and Abstracts Views on Vision4Press platform.
Data correspond to usage on the plateform after 2015. The current usage metrics is available 48-96 hours after online publication and is updated daily on week days.
Initial download of the metrics may take a while.