Fig. 7.
Download original image
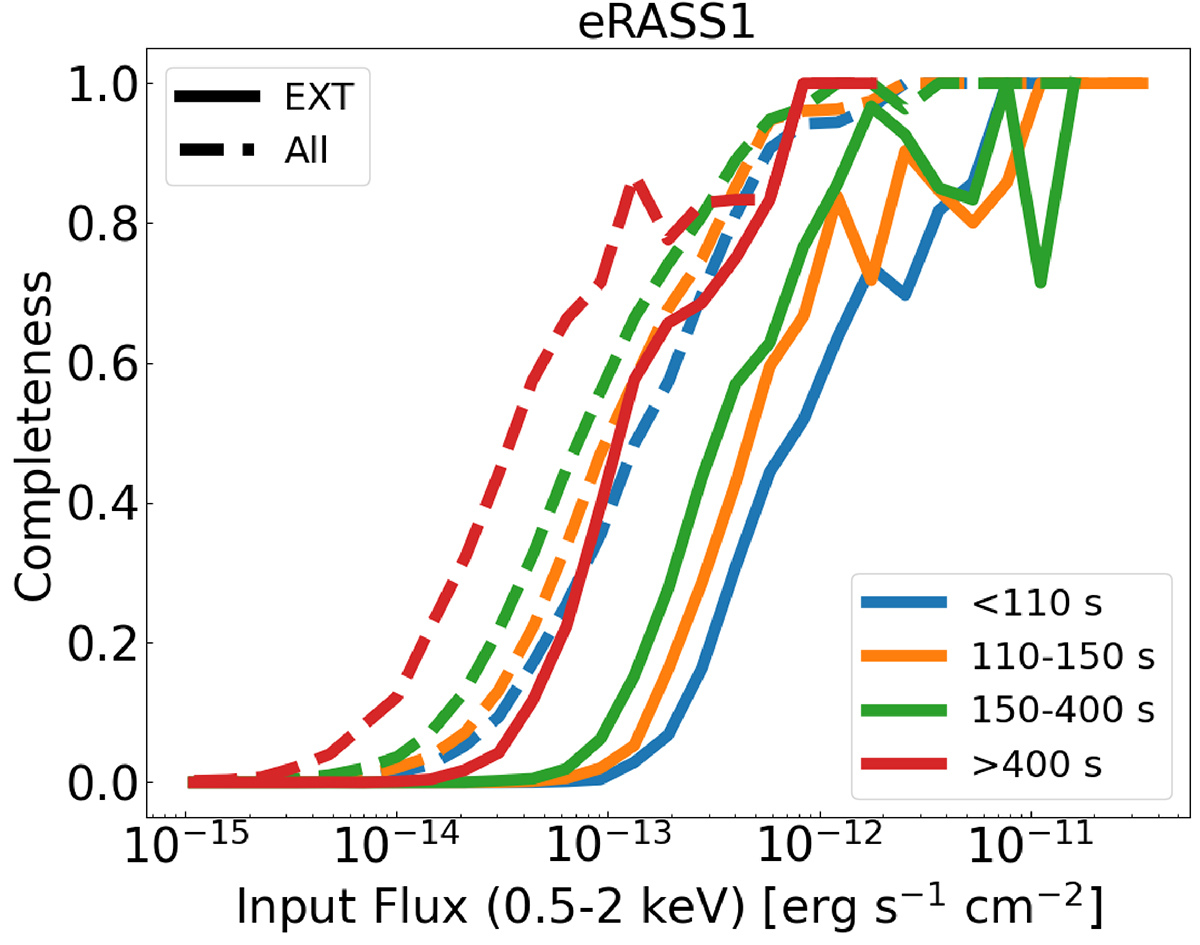
Fraction of simulated clusters with a counterpart in the eSASS catalog as a function of simulated soft X-ray flux. We do not apply any additional likelihood selection. Each color identifies an exposure time range. Solid lines denote clusters only detected as extended, while dashed ones include the ones detected as point sources.
Current usage metrics show cumulative count of Article Views (full-text article views including HTML views, PDF and ePub downloads, according to the available data) and Abstracts Views on Vision4Press platform.
Data correspond to usage on the plateform after 2015. The current usage metrics is available 48-96 hours after online publication and is updated daily on week days.
Initial download of the metrics may take a while.