Open Access
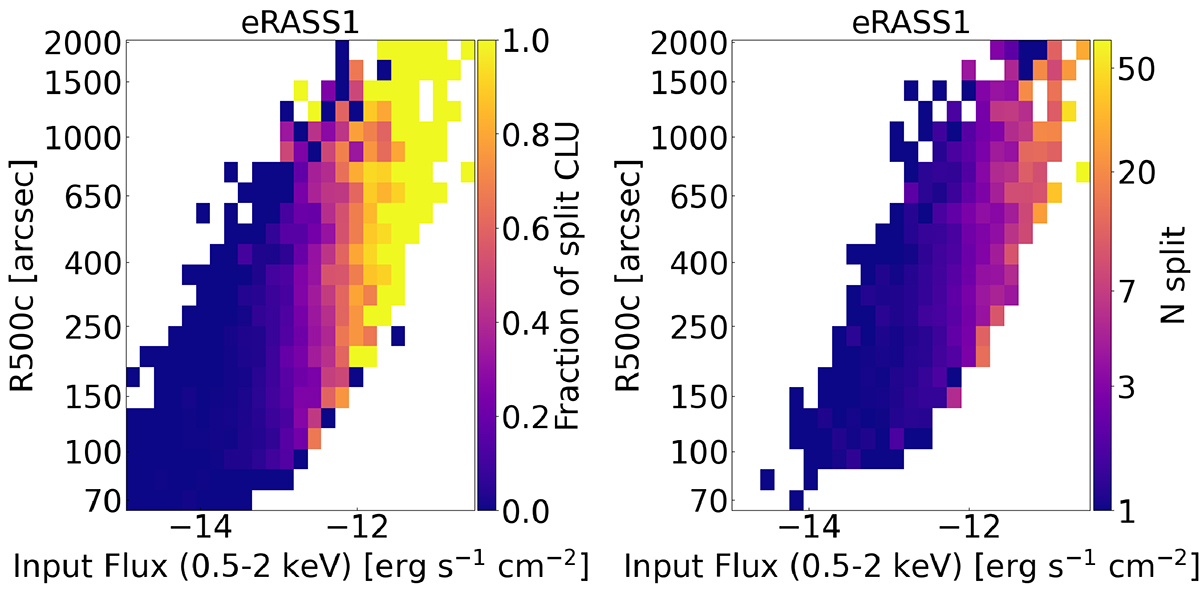
Fig. 4.
Download original image
Number of split sources as a function of flux and R500c. The left-hand panel shows the fraction of detected clusters that are split into multiple sources, the right-hand one displays the average number of sources which a cluster with given flux and size is split into. The blank spaces contain no input clusters.
Current usage metrics show cumulative count of Article Views (full-text article views including HTML views, PDF and ePub downloads, according to the available data) and Abstracts Views on Vision4Press platform.
Data correspond to usage on the plateform after 2015. The current usage metrics is available 48-96 hours after online publication and is updated daily on week days.
Initial download of the metrics may take a while.