Fig. F.1.
Download original image
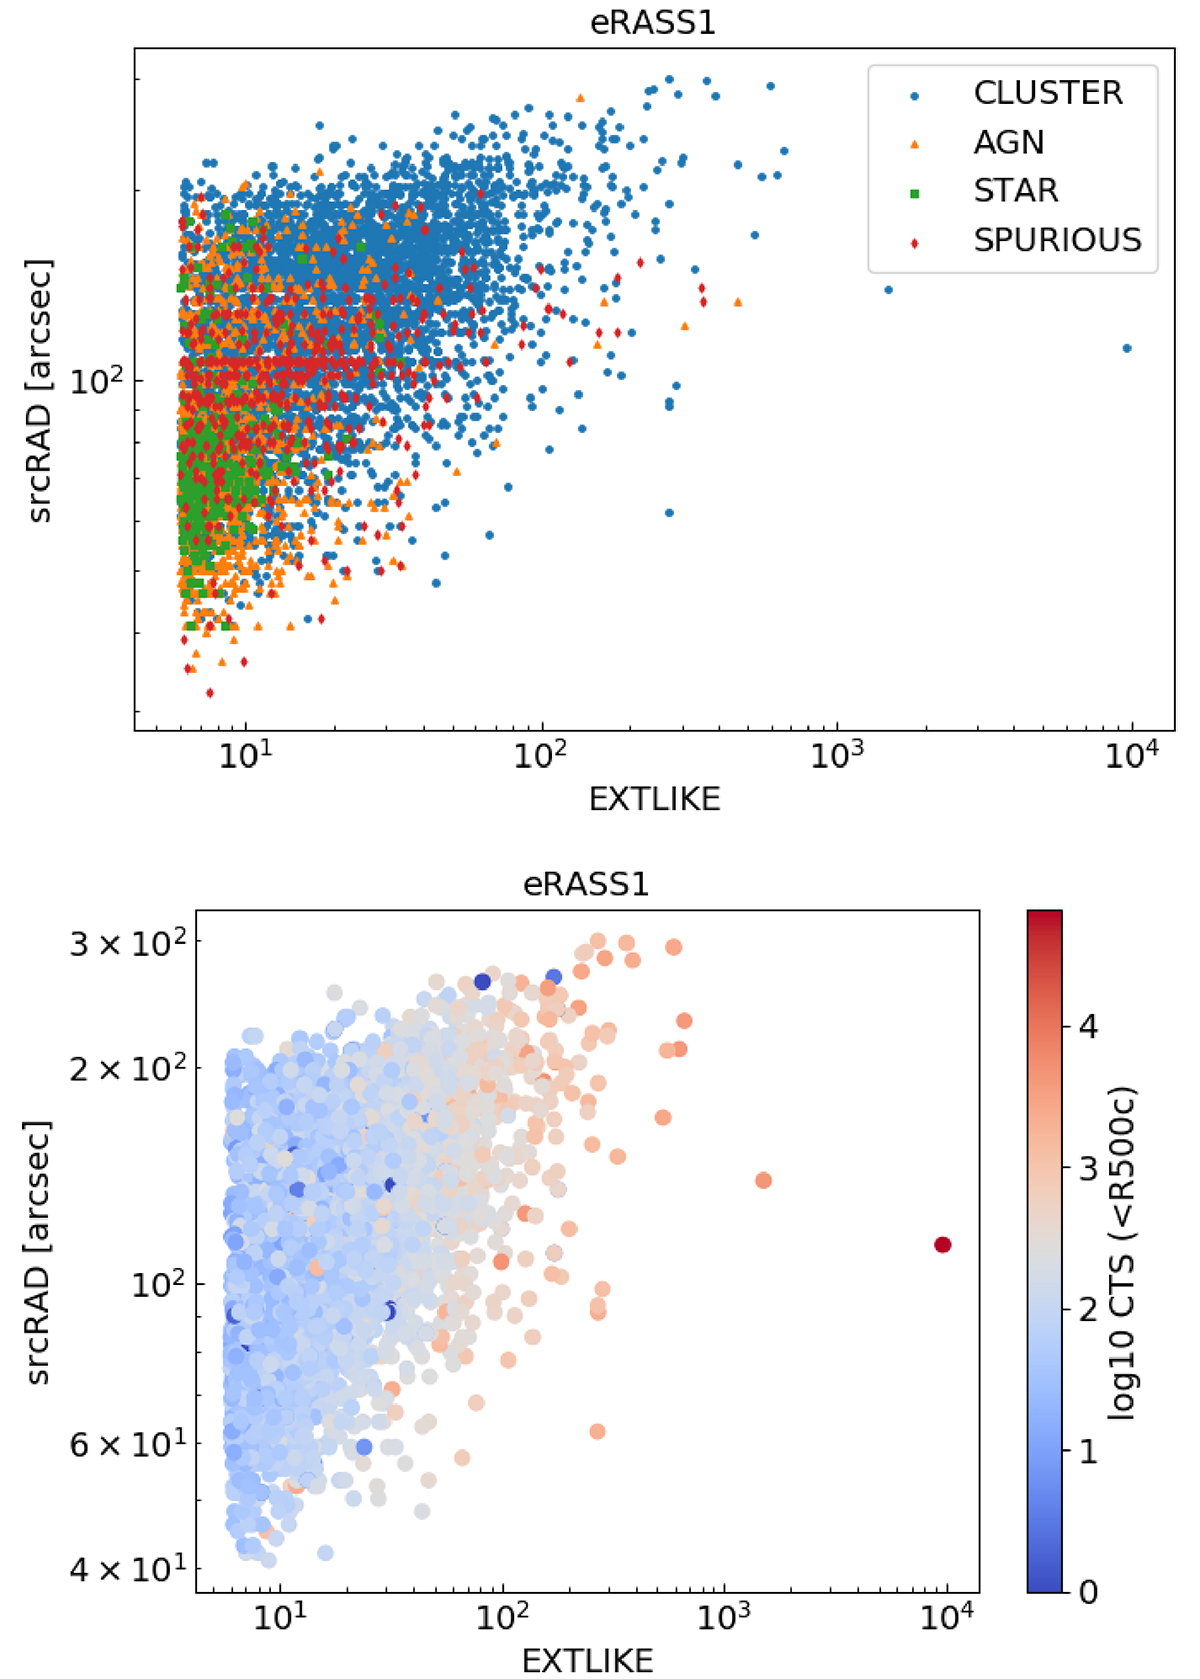
Distribution of the eSASS sources as a function of srcRAD and EXT_LIKE. Top panel: entire source catalog for the eRASS1 simulation in the srcRAD-EXT_LIKE parameter space. Clusters are identified by blue circles, AGN by yellow triangles, stars by green squares, and spurious sources plus secondary matches to simulated objects by red diamonds. Bottom panel: detected clusters color-coded by simulated counts in the 0.2–2.3 keV band inside R500c.
Current usage metrics show cumulative count of Article Views (full-text article views including HTML views, PDF and ePub downloads, according to the available data) and Abstracts Views on Vision4Press platform.
Data correspond to usage on the plateform after 2015. The current usage metrics is available 48-96 hours after online publication and is updated daily on week days.
Initial download of the metrics may take a while.