Fig. E.1.
Download original image
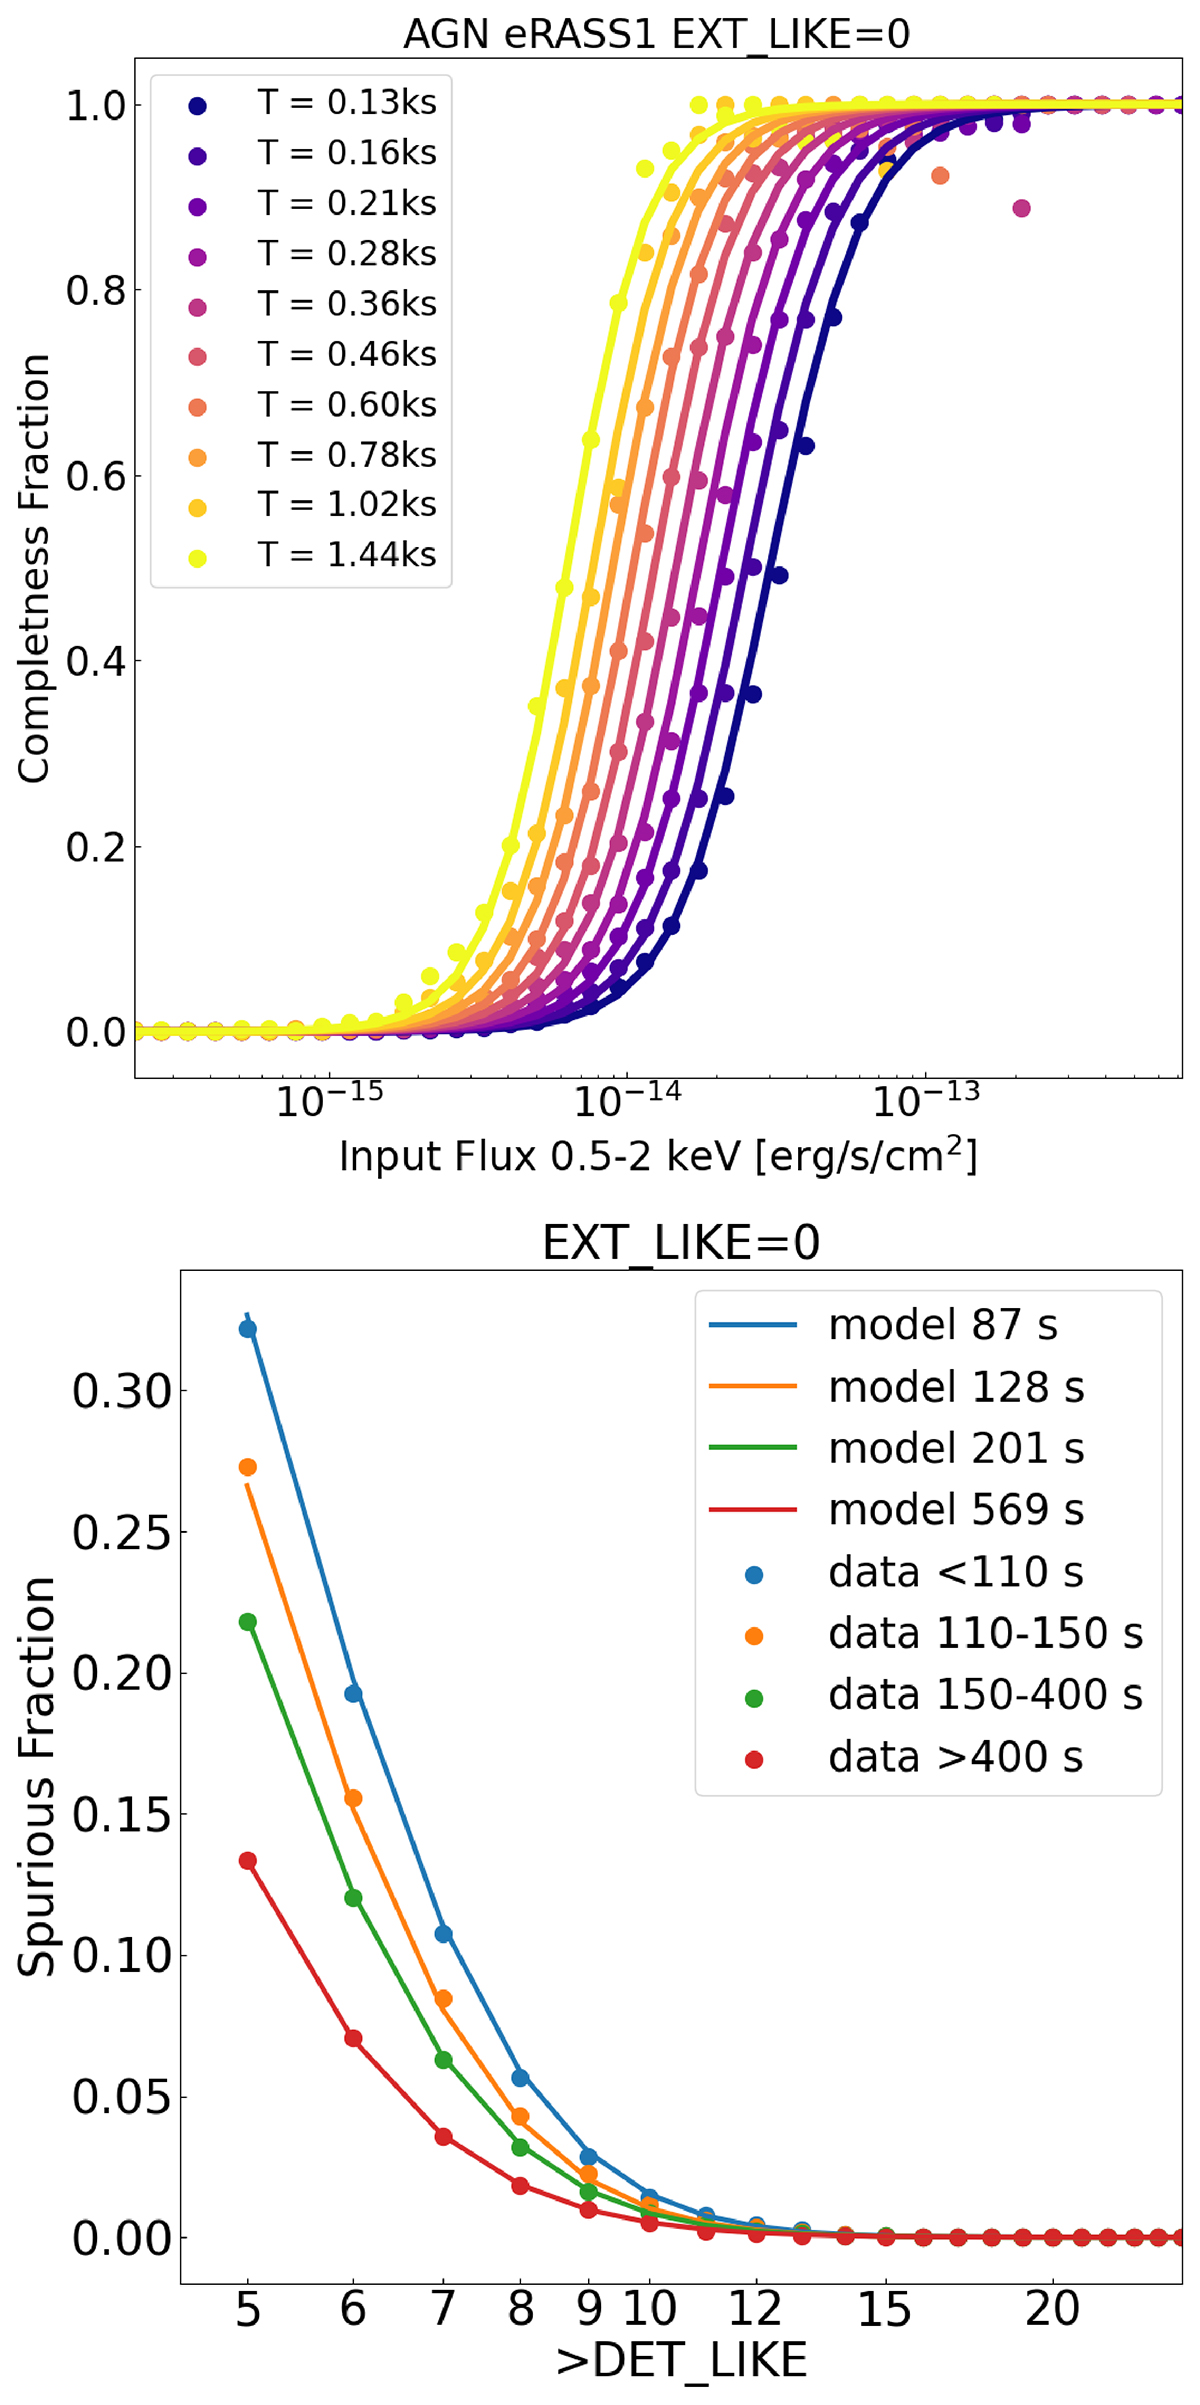
The point source sample. Top panel: fraction of AGN detected as point-like objects as a function of the input flux in the soft X-ray band for different exposure times. The circles show the values measured comparing input and source catalogs, the solid lines our best fit model in Eq. E.1. Bottom panel: fraction of spurious sources in the point source sample as a function of detection likelihood cuts for different exposure times. The full circles denote the false detection rate measured in the simulation, the solid lines identify the model described by Equation E.2 computed at the average exposure time corresponding to each bin.
Current usage metrics show cumulative count of Article Views (full-text article views including HTML views, PDF and ePub downloads, according to the available data) and Abstracts Views on Vision4Press platform.
Data correspond to usage on the plateform after 2015. The current usage metrics is available 48-96 hours after online publication and is updated daily on week days.
Initial download of the metrics may take a while.