Fig. 2.
Download original image
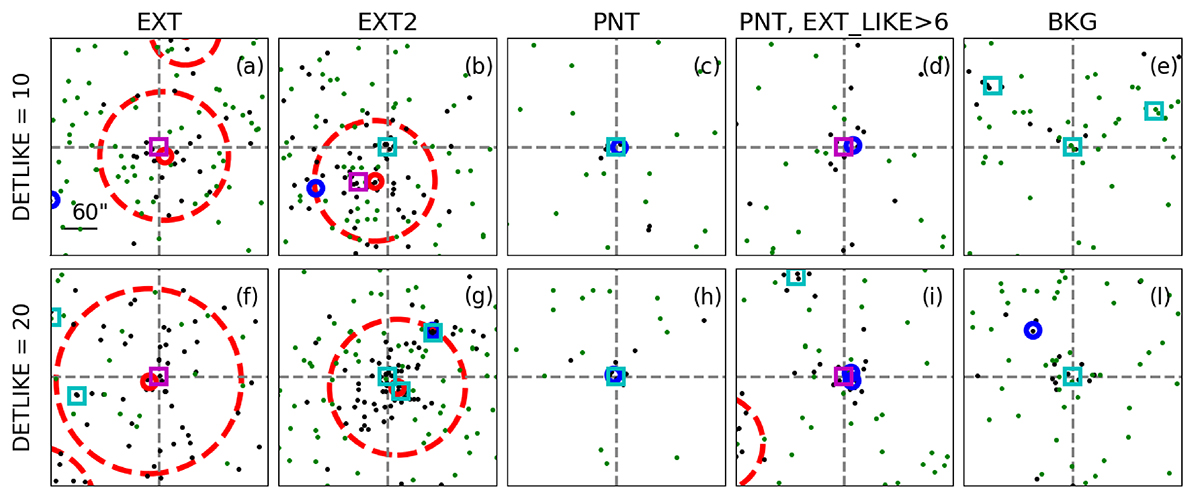
Examples of the eSASS catalog classification. Red (blue) solid circles show simulated clusters (AGN). Magenta (cyan) squares denote extended (point-like) eSASS entries, like in Fig. 1. The dashed red circles enclose 0.5 × R500c of a simulated cluster. Soft X-ray photons from simulated sources are represented by black dots, the green ones come from the background. The first (second) row shows examples for sources with DET_LIKE = 10 (20). Columns show respectively: an extended detection uniquely assigned to a simulated cluster, a secondary detection assigned to an input cluster, a point detection uniquely assigned to an AGN, an extended detection uniquely assigned to an AGN, and a detection without any simulated input. All panels have the same physical size. A ruler of 60 arcsec is shown in the top-left one.
Current usage metrics show cumulative count of Article Views (full-text article views including HTML views, PDF and ePub downloads, according to the available data) and Abstracts Views on Vision4Press platform.
Data correspond to usage on the plateform after 2015. The current usage metrics is available 48-96 hours after online publication and is updated daily on week days.
Initial download of the metrics may take a while.