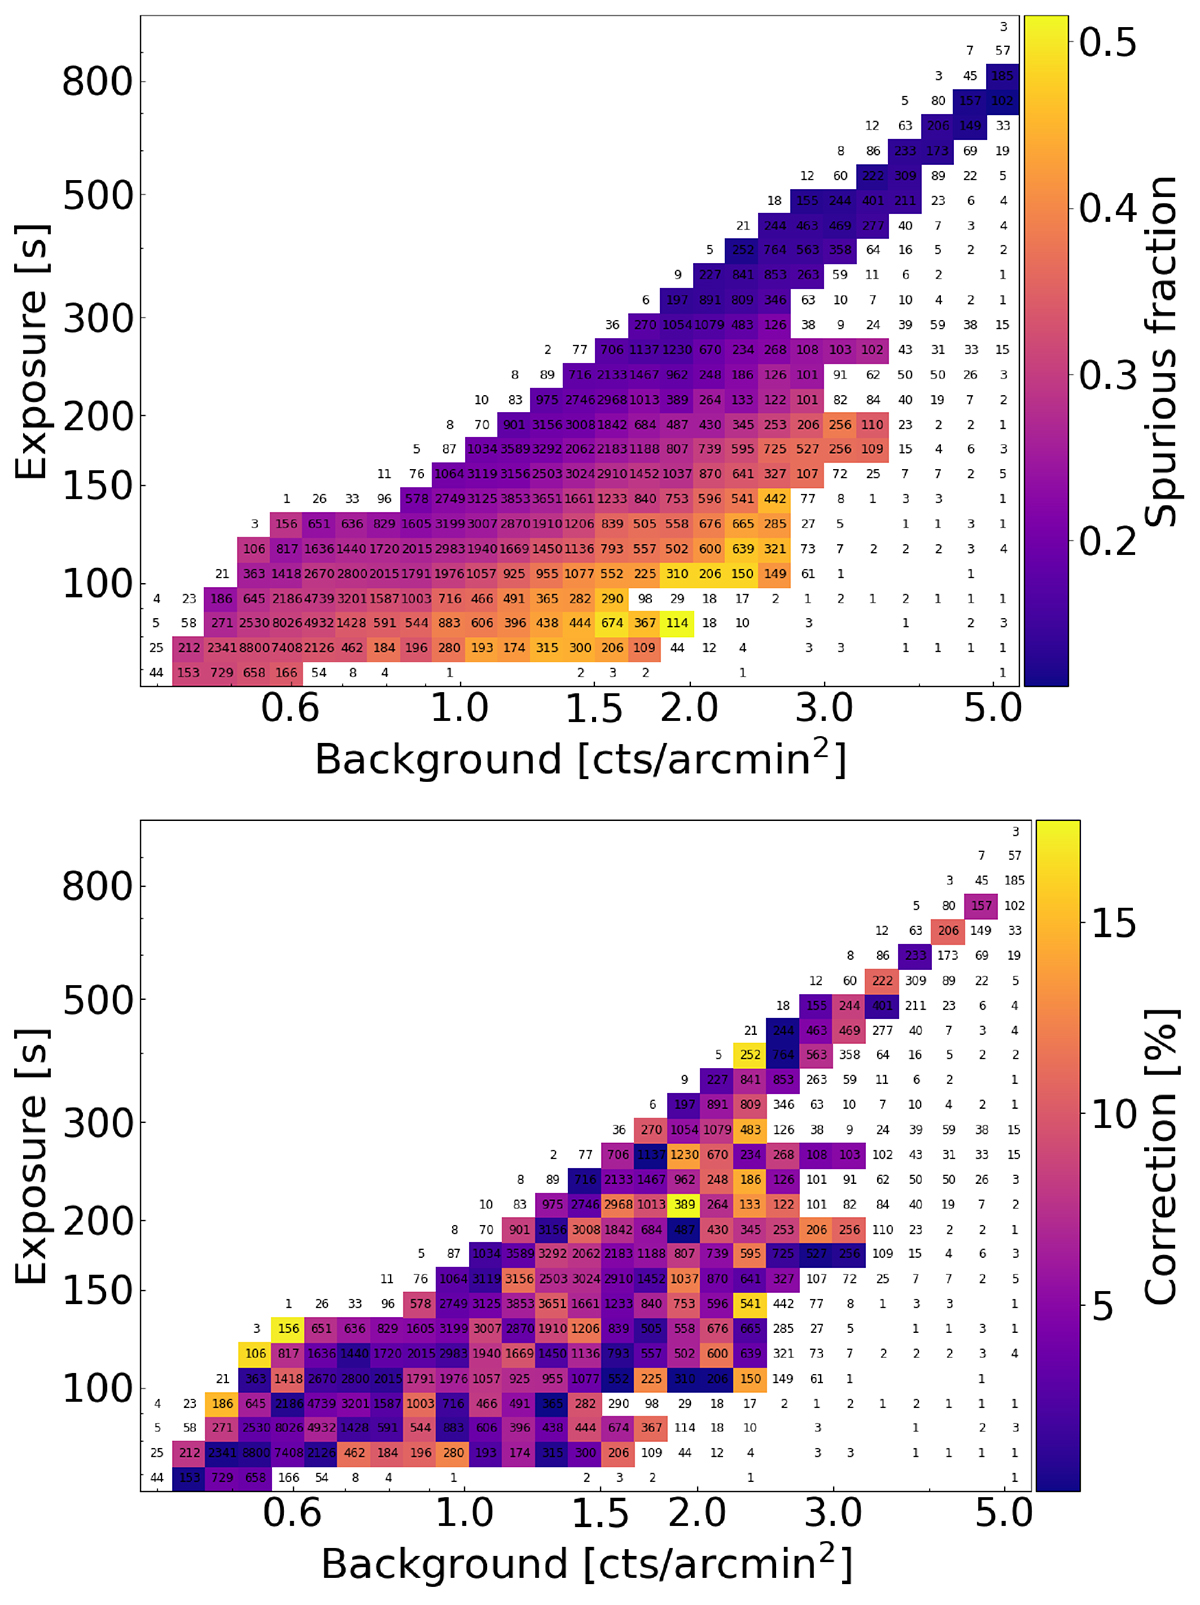
Fig. C.3.
Download original image
Evolution of the false detection rate in the eRASS1 simulation. Top panel: spurious fraction as a function exposure time and background level in the eRASS1 simulation. Each bin containing more than 100 sources is color-coded by the false detection rate. Lower panel: correction of the prediction of the spurious fraction for the eRASS1 data using the simulation due to the 10% overestimate of the background. The x-axis is binned with a progressive 10% increment. The total number of spurious sources in each bin is written as text.
Current usage metrics show cumulative count of Article Views (full-text article views including HTML views, PDF and ePub downloads, according to the available data) and Abstracts Views on Vision4Press platform.
Data correspond to usage on the plateform after 2015. The current usage metrics is available 48-96 hours after online publication and is updated daily on week days.
Initial download of the metrics may take a while.