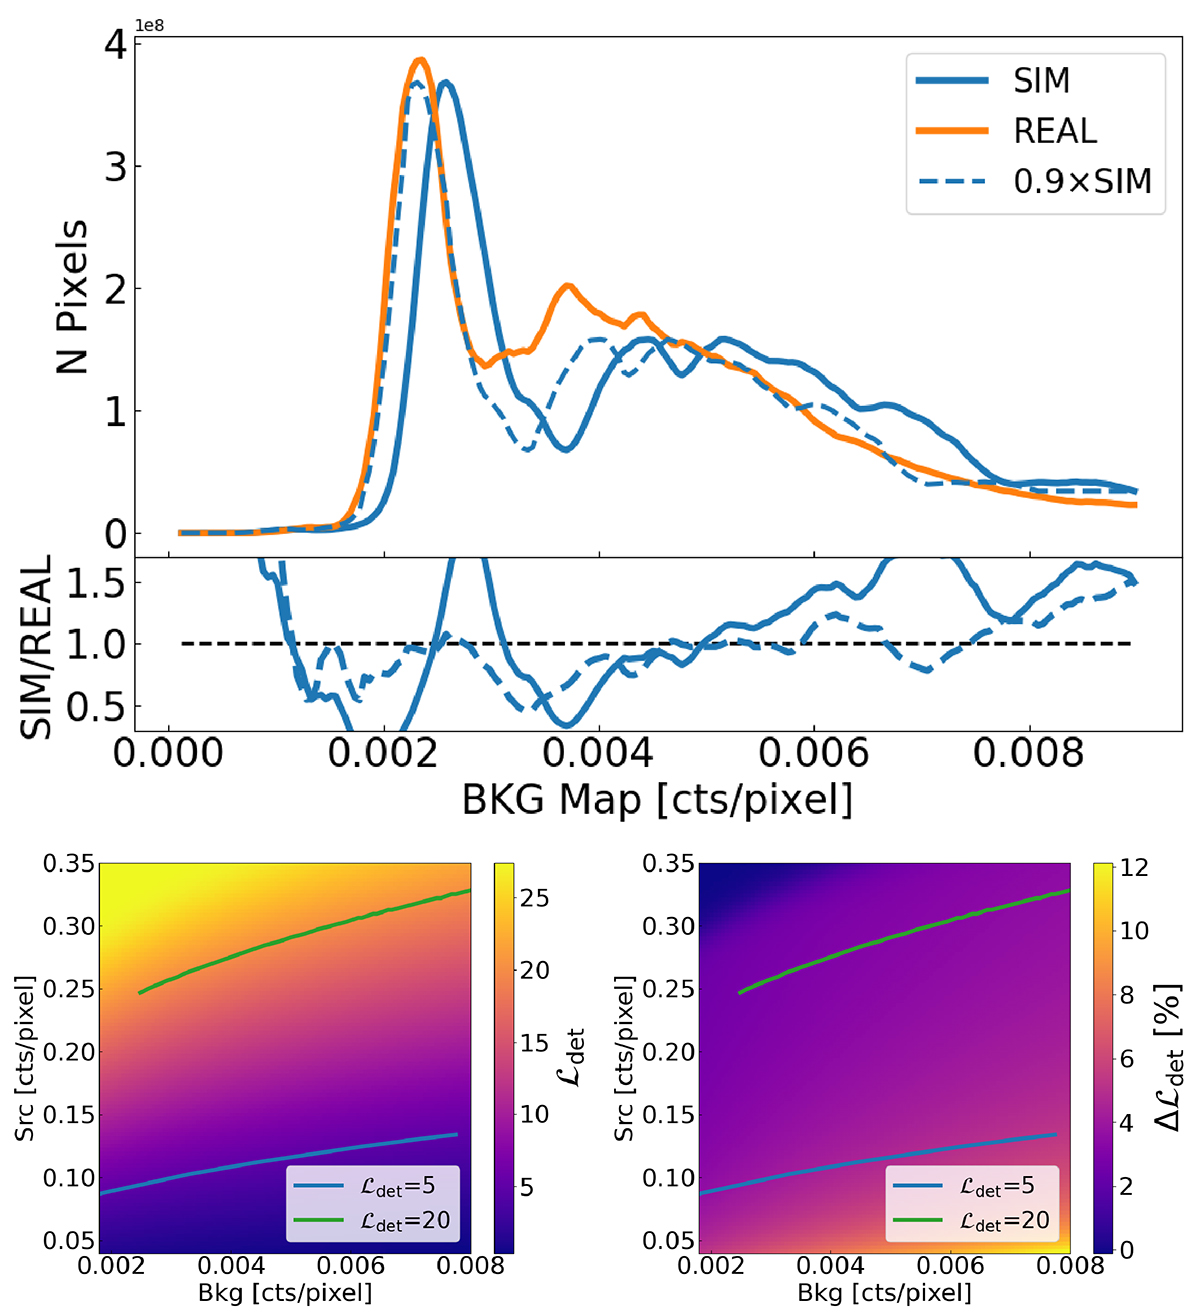
Fig. C.2.
Download original image
Background evaluation in the eRASS1 simulation. Top panel: comparison between the mock and real background maps. The lines identify the number of pixels showing a given value of the background map. The mock data is denoted in blue, the real eRASS1 in orange. The dashed blue line shows the simulated background re-scaled by 0.9. The lower panel shows the ratio between the mock and real data. Bottom panels: impact of a 10% overestimation of the background on the analytically computed value of detection likelihood. The left-hand panel shows DET_LIKE as a function of counts in each pixel given by a source and by the background. The panel on the right shows the corresponding percentage error on detection likelihood caused by a 10% larger background. The blue and the green solid lines respectively denote DET_LIKE = 5 and 20.
Current usage metrics show cumulative count of Article Views (full-text article views including HTML views, PDF and ePub downloads, according to the available data) and Abstracts Views on Vision4Press platform.
Data correspond to usage on the plateform after 2015. The current usage metrics is available 48-96 hours after online publication and is updated daily on week days.
Initial download of the metrics may take a while.