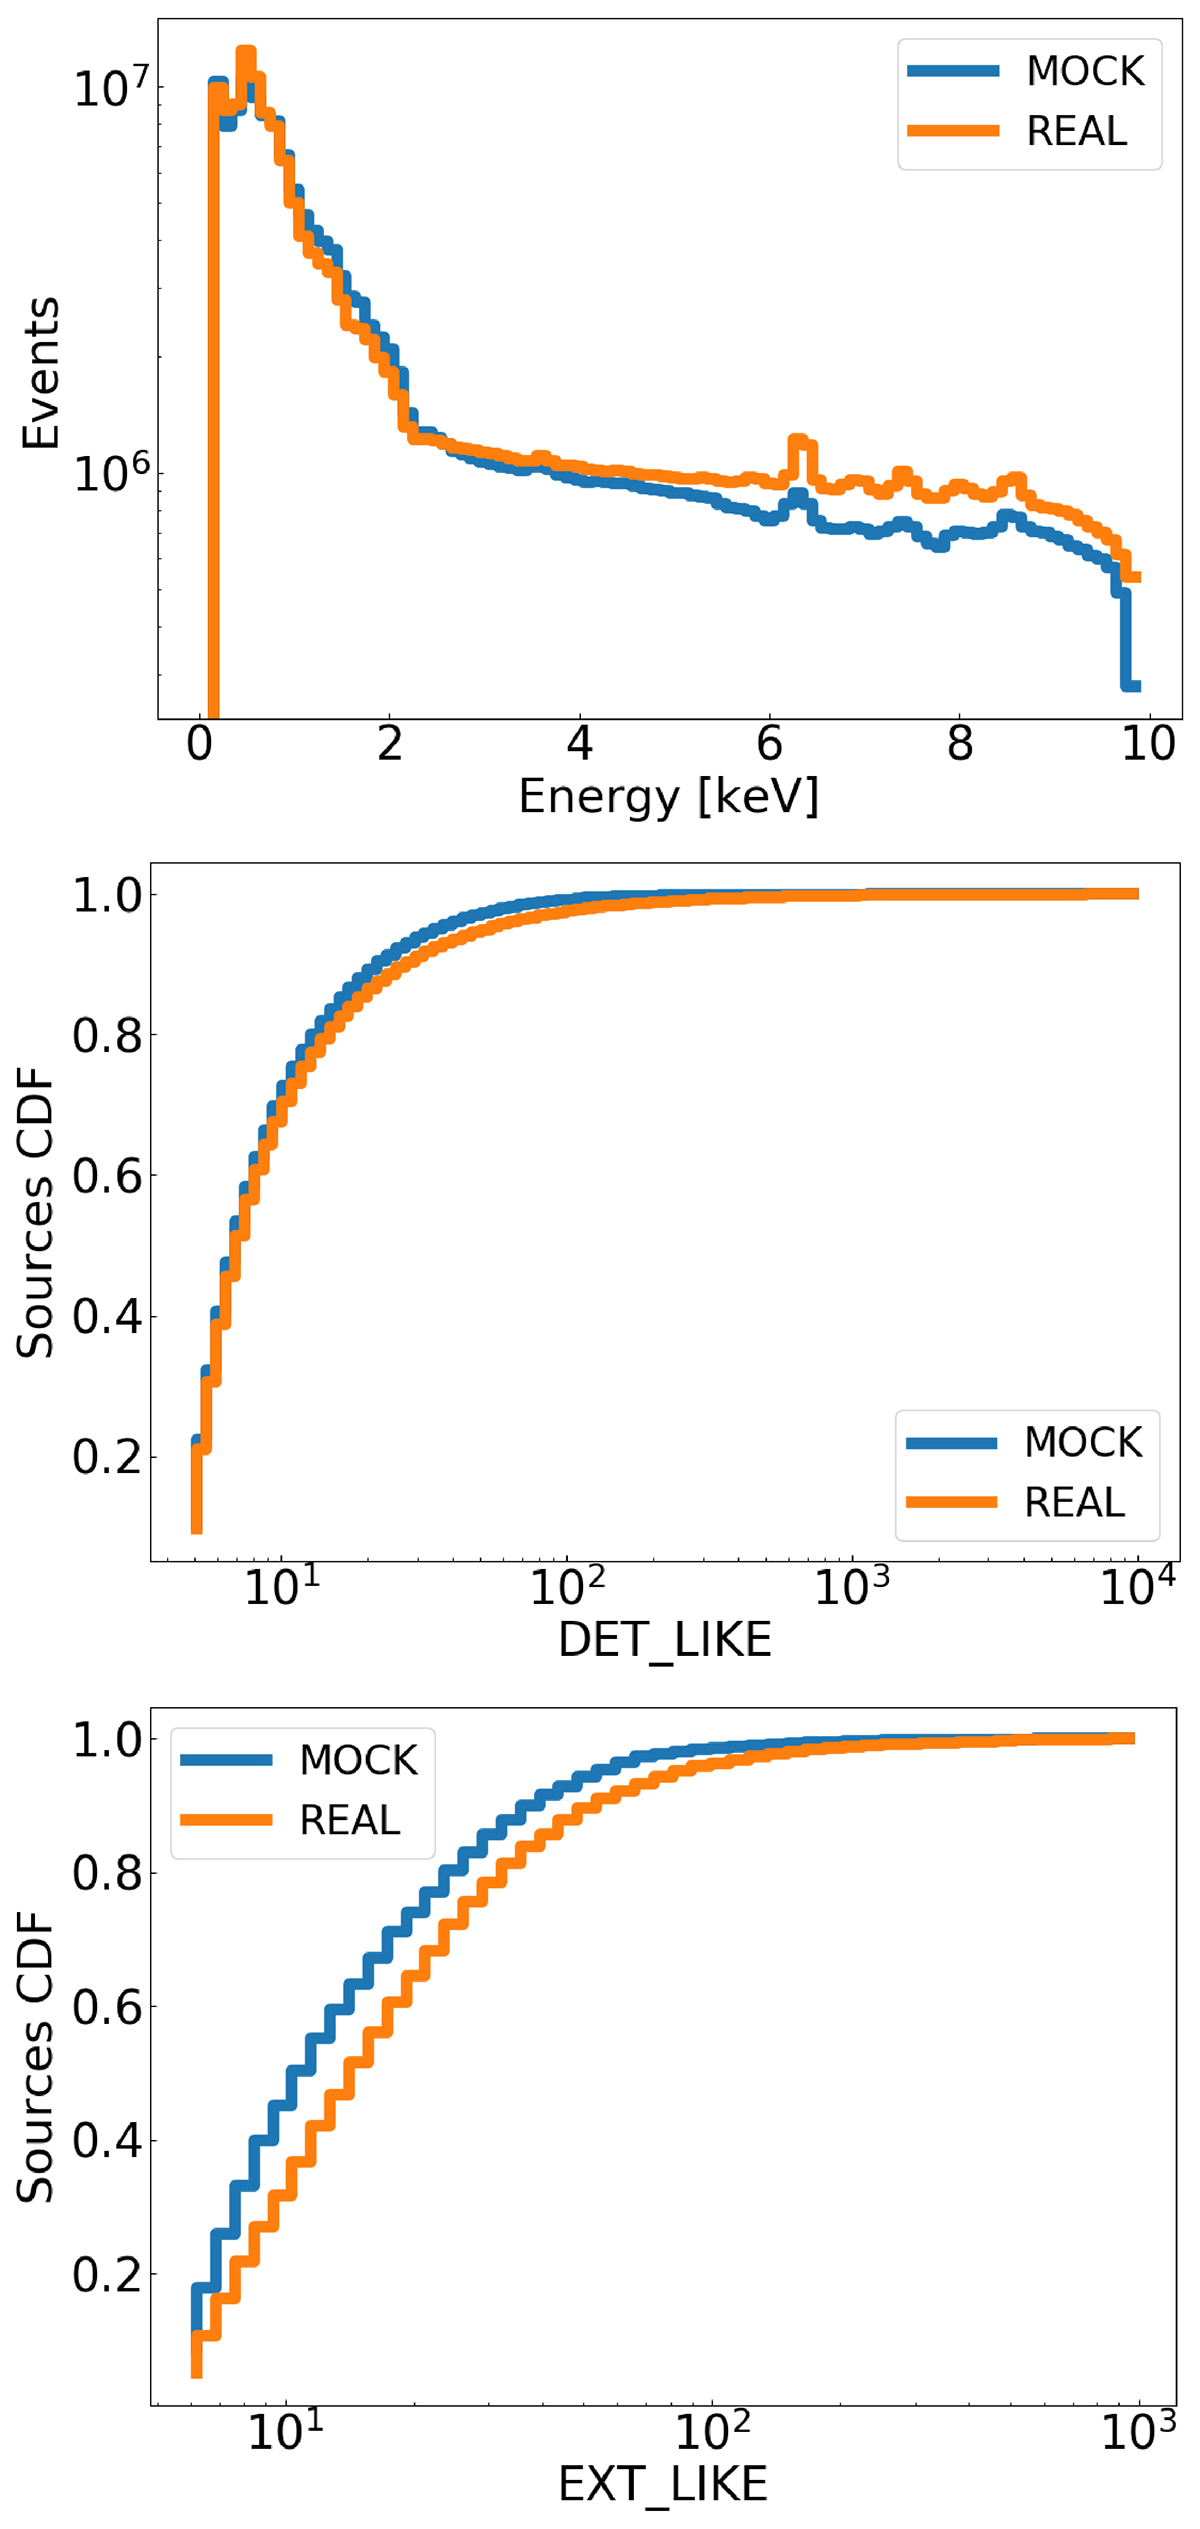
Fig. C.1.
Download original image
Comparison between the eRASS1 simulation and the real data. These are respectively denoted by the blue and the orange solid lines. Top panel: distribution of the photon energy. Central panel: cumulative distribution of the sources as a function of detection likelihood. Bottom panel: cumulative distribution of the sources as a function of extension likelihood.
Current usage metrics show cumulative count of Article Views (full-text article views including HTML views, PDF and ePub downloads, according to the available data) and Abstracts Views on Vision4Press platform.
Data correspond to usage on the plateform after 2015. The current usage metrics is available 48-96 hours after online publication and is updated daily on week days.
Initial download of the metrics may take a while.