Open Access
Fig. B.2.
Download original image
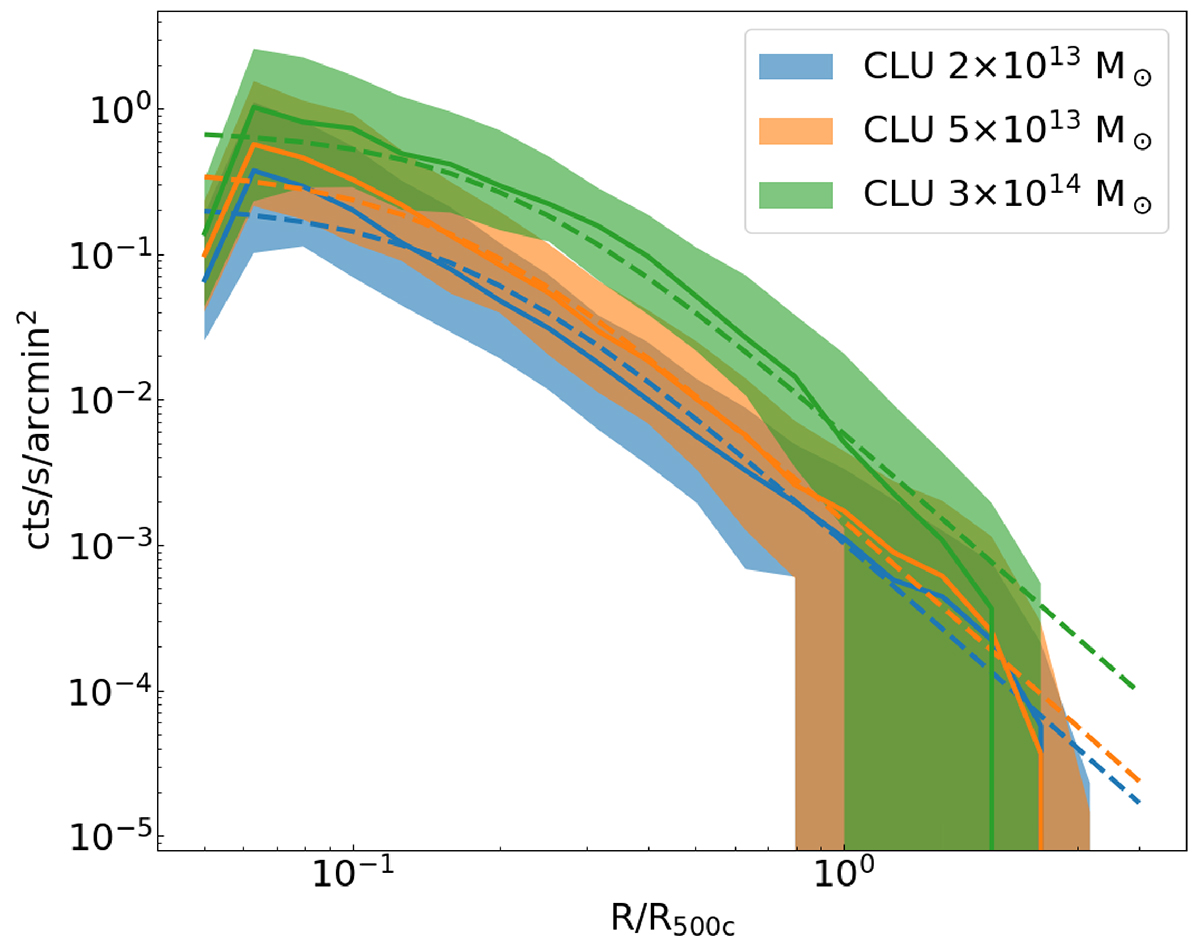
Surface brightness profiles of the simulated clusters. The radius is normalized to R500c. The solid lines show the average profile, the shaded areas denote the 1σ scatter around the mean. The dashed lines show the best-fitting beta model for each average profile.
Current usage metrics show cumulative count of Article Views (full-text article views including HTML views, PDF and ePub downloads, according to the available data) and Abstracts Views on Vision4Press platform.
Data correspond to usage on the plateform after 2015. The current usage metrics is available 48-96 hours after online publication and is updated daily on week days.
Initial download of the metrics may take a while.