Fig. 14.
Download original image
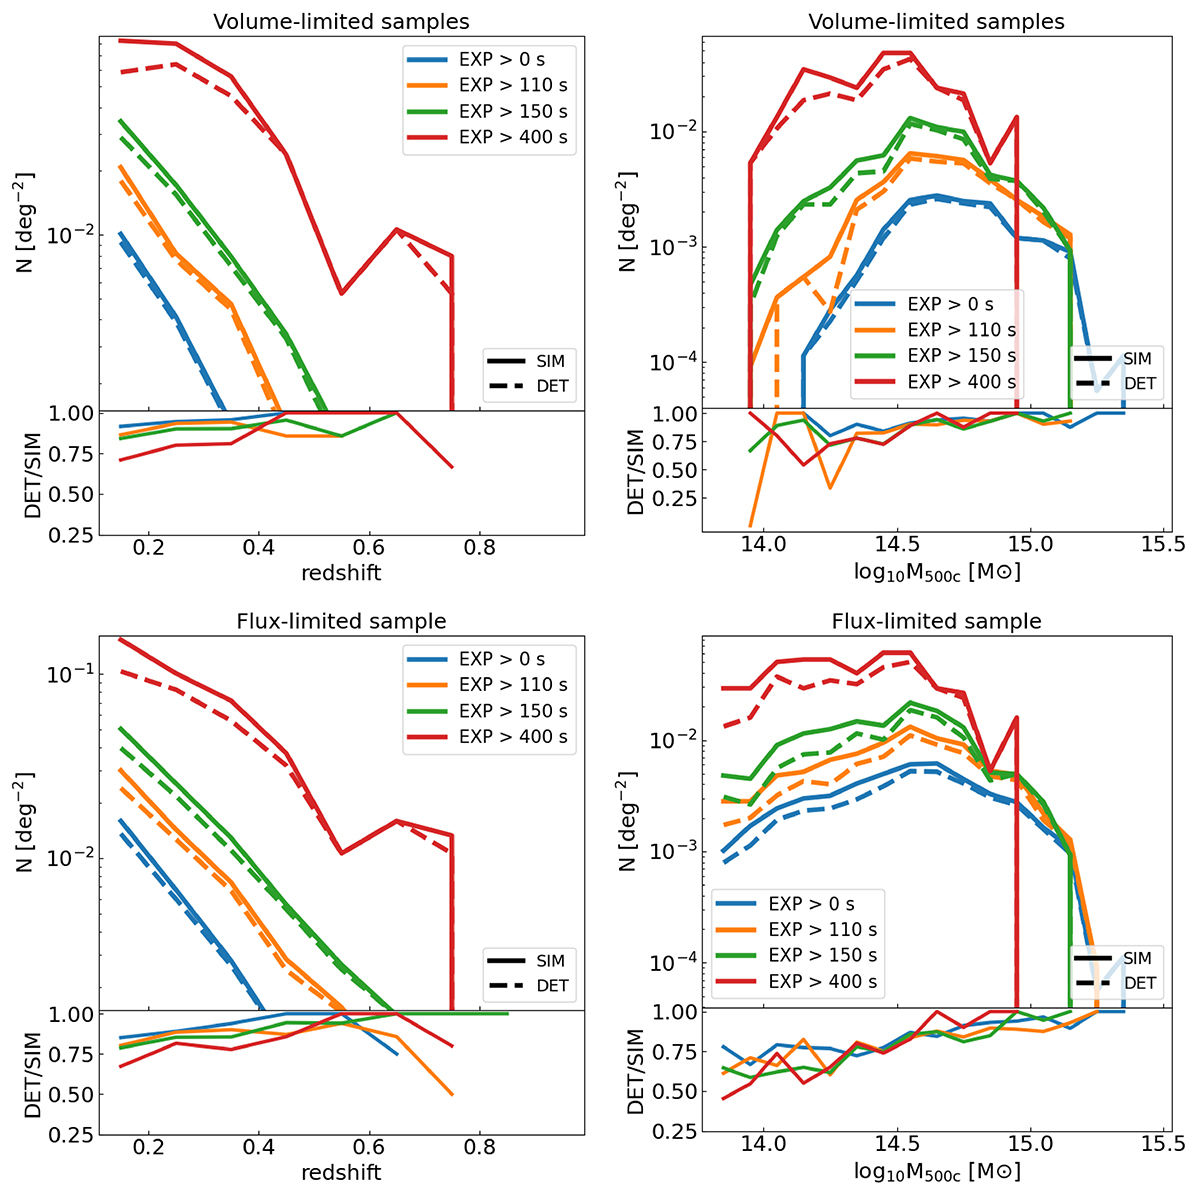
Comparison between the volume-limited and flux-limited samples built with clusters detected as extended and simulated ones. The top panels display the volume-limited samples, the bottom panels show the flux-limited ones. Left-hand panels: relative contribution to the total cluster number density as a function of redshift for the four different populations. The lower plot shows the ratio between the N(z) built with the samples of detected and simulated clusters. Right-hand panels: relative contribution to the total cluster number density as a function of mass for the four different populations. The lower plot shows the ratio between the N(z) built with the samples of detected and simulated clusters.
Current usage metrics show cumulative count of Article Views (full-text article views including HTML views, PDF and ePub downloads, according to the available data) and Abstracts Views on Vision4Press platform.
Data correspond to usage on the plateform after 2015. The current usage metrics is available 48-96 hours after online publication and is updated daily on week days.
Initial download of the metrics may take a while.