Fig. 13.
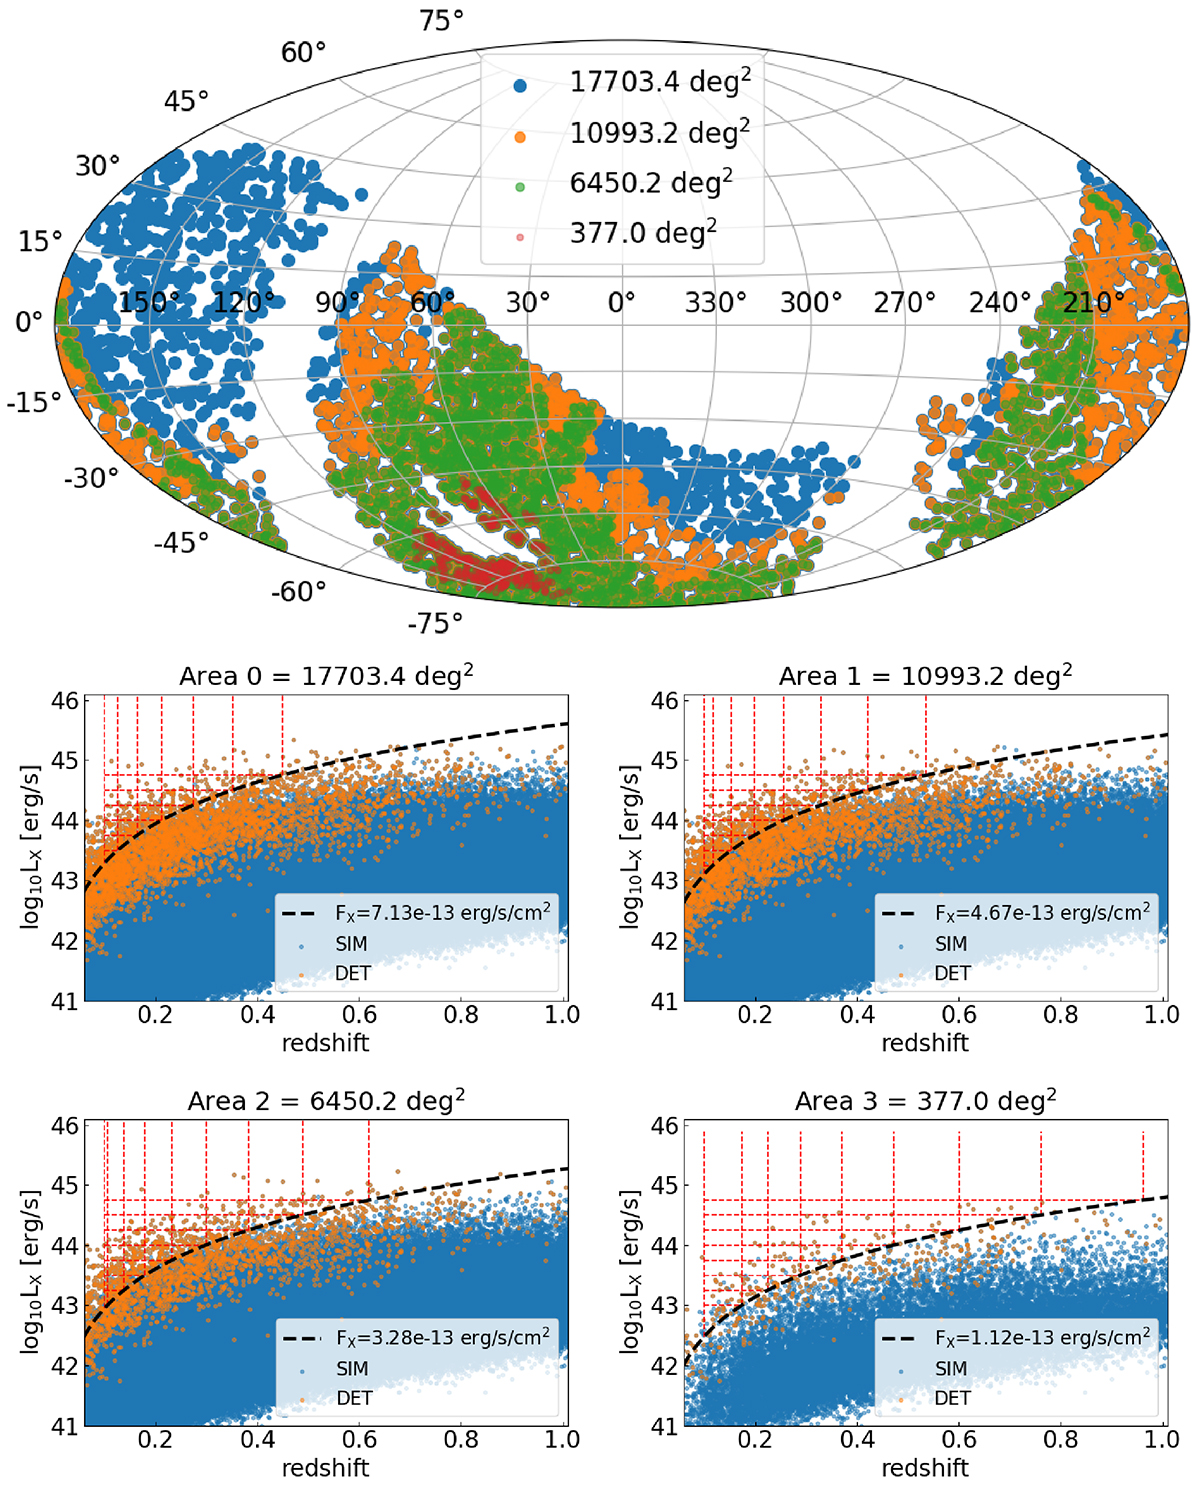
Download original image
Selection of a volume-limited cluster sample in the eRASS1 simulation. Top panel: sky map with the cluster population in areas covered by different depth. Areas 0, 1, 2, and 3 respectively cover regions with exposure larger than 0 s, 110 s, 150 s, and 400 s. They are cumulative areas with respect to the ones defined in Table 4. Bottom panels: population of simulated and detected clusters in the luminosity–redshift plane. The black dashed lines denote the chosen flux threshold at each depth (see Table 4). The red dashed lines locate different areas above the given flux limits. The volume-limited sample is constructed with the objects within the regions delimited by these lines.
Current usage metrics show cumulative count of Article Views (full-text article views including HTML views, PDF and ePub downloads, according to the available data) and Abstracts Views on Vision4Press platform.
Data correspond to usage on the plateform after 2015. The current usage metrics is available 48-96 hours after online publication and is updated daily on week days.
Initial download of the metrics may take a while.