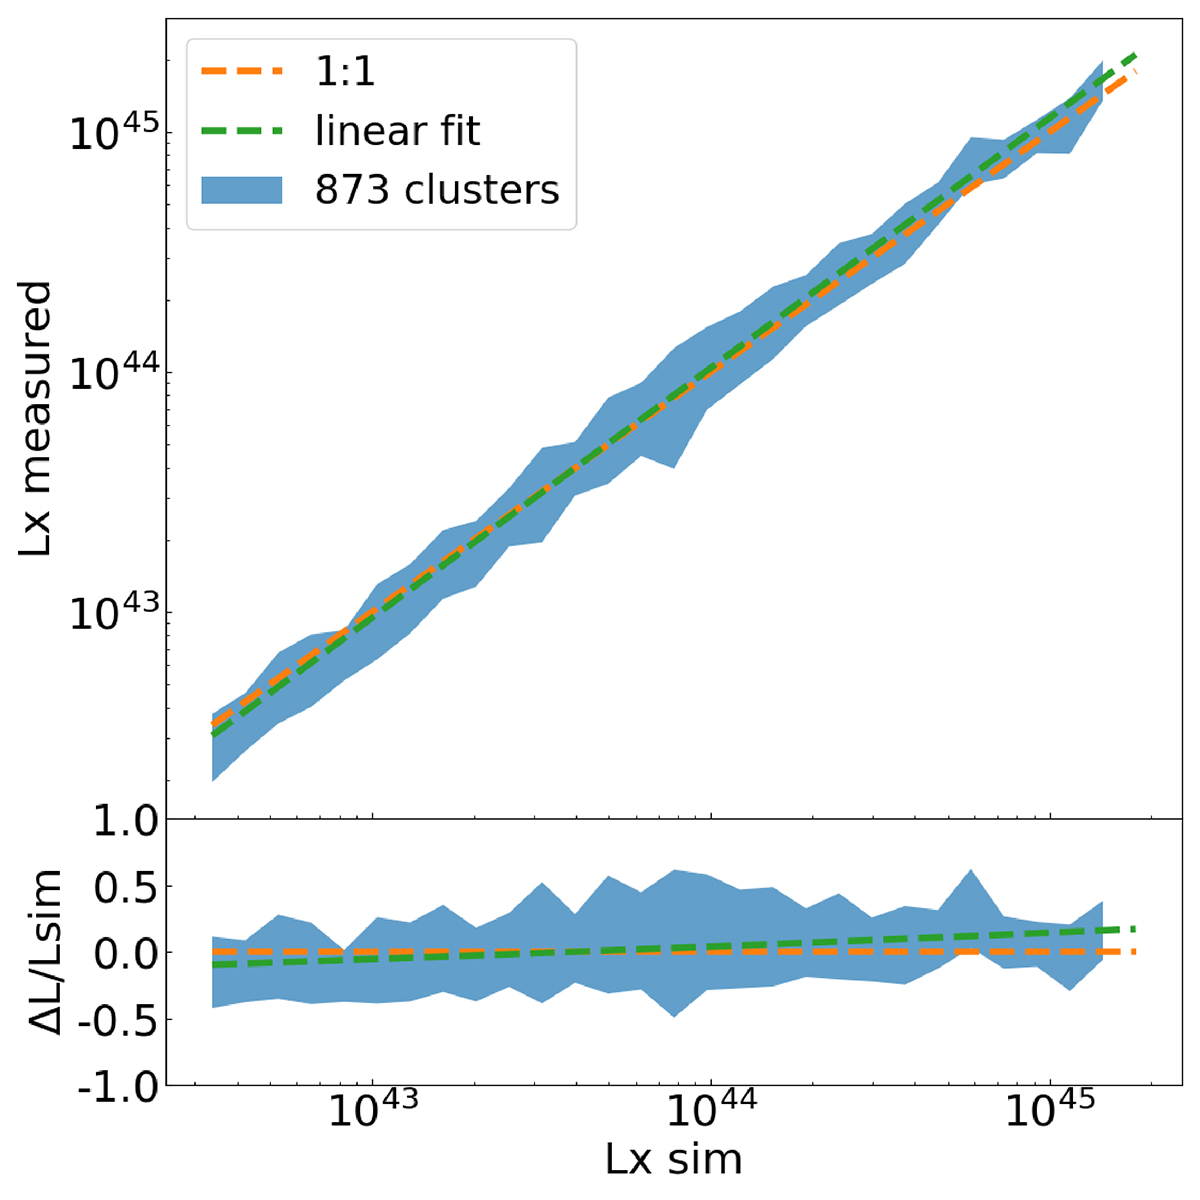
Fig. 12.
Download original image
Measure of X-ray luminosity. Top panel: comparison between average values of measured X-ray luminosity as a function of input ones. The blue shaded area encloses the average measured luminosity within 1σ uncertainties. The dashed orange line shows a perfect one-to-one relation. Lower panel: residual plot normalized by the input luminosity.
Current usage metrics show cumulative count of Article Views (full-text article views including HTML views, PDF and ePub downloads, according to the available data) and Abstracts Views on Vision4Press platform.
Data correspond to usage on the plateform after 2015. The current usage metrics is available 48-96 hours after online publication and is updated daily on week days.
Initial download of the metrics may take a while.