Fig. 1.
Download original image
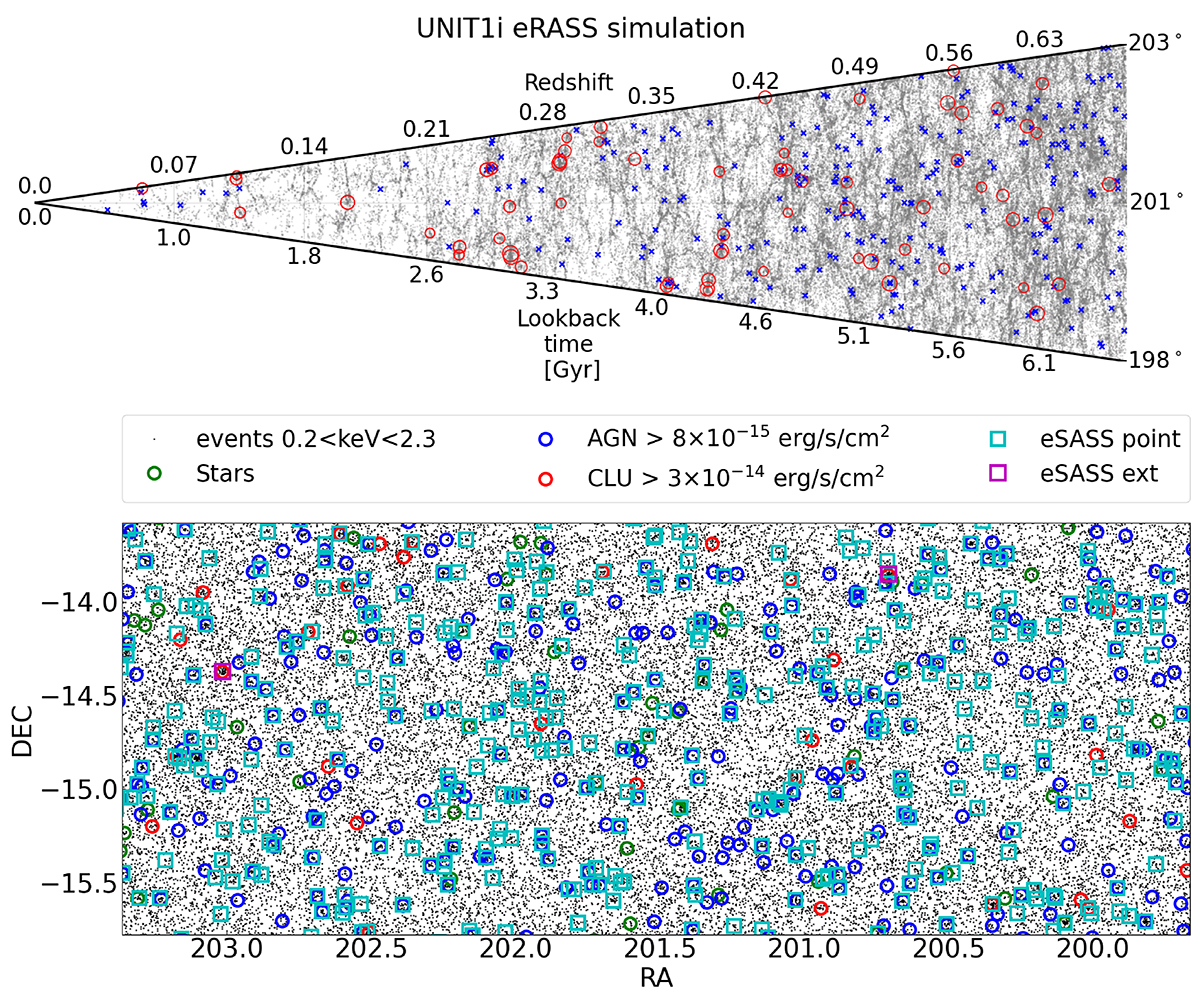
Large-scale distribution of extragalactic sources and their X-ray view in the simulation. Top panel: light cone of the UNIT1i-eRASS1 simulation. The wedge shows the fraction of the sky enclosed by the same RA and Dec of the bottom panel as a function of redshift and lookback time. The galaxies tracing the large-scale structure are shown in grey. The AGN are denoted in blue. The red circles show clusters and groups. The size of the circle is proportional to the mass of the object. Bottom panel: central regions of tile 202105 of the eRASS1 simulation. This is the projection on the plane of the sky of light cone shown in the top panel. Photons with energies between 0.2 to 2.3 keV are shown by black dots, simulated stars by green circles, simulated AGN by blue circles, simulated clusters by red circles, eSASS extended detections by magenta squares, and eSASS point-like detections by cyan squares.
Current usage metrics show cumulative count of Article Views (full-text article views including HTML views, PDF and ePub downloads, according to the available data) and Abstracts Views on Vision4Press platform.
Data correspond to usage on the plateform after 2015. The current usage metrics is available 48-96 hours after online publication and is updated daily on week days.
Initial download of the metrics may take a while.