Open Access
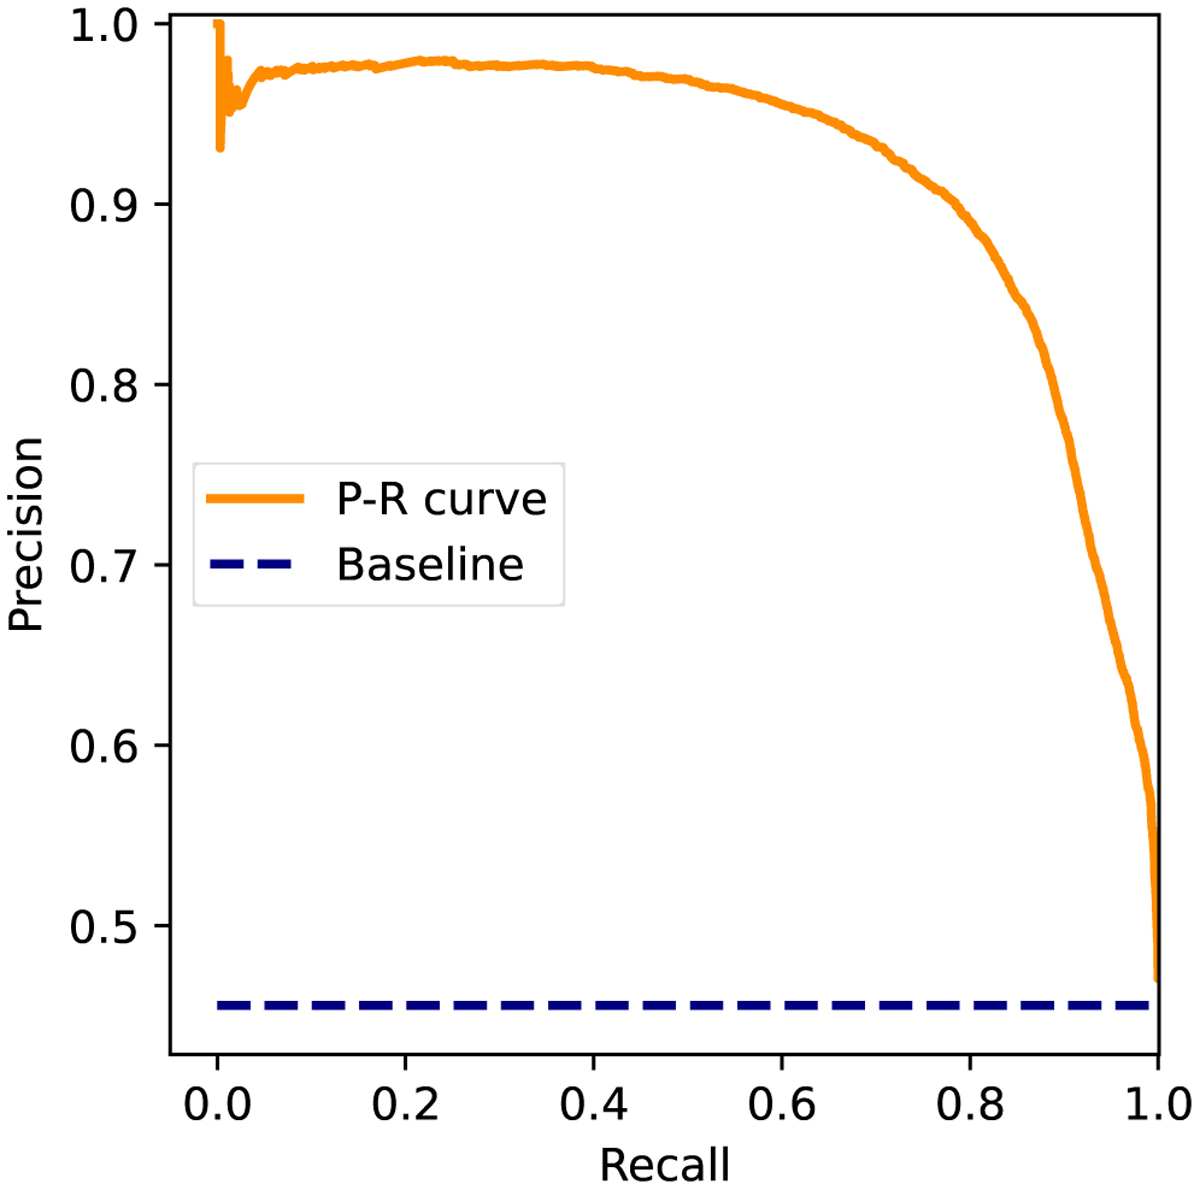
Fig. 6
Download original image
Precision-recall curve for selection by SNGuess from the test data set. The baseline performance shown by the blue dashed line corresponds to the ratio between relevant and total number of examples, and is an indicator of the imbalance between classes.
Current usage metrics show cumulative count of Article Views (full-text article views including HTML views, PDF and ePub downloads, according to the available data) and Abstracts Views on Vision4Press platform.
Data correspond to usage on the plateform after 2015. The current usage metrics is available 48-96 hours after online publication and is updated daily on week days.
Initial download of the metrics may take a while.